Overall
Despite its claim, the guidance on inventory is not about inventory.
IAS 2 is titled Inventories.
ASC 330 is titled Inventory.
IAS 2 begins by stating: the objective of this standard is to prescribe the accounting treatment for inventories...
ASC 330 begins by stating: the inventory topic addresses the accounting principles and reporting practices applicable to inventory.
These statements are true, but they are not correct.
Ontologically, the guidance does not actually address inventory, but what inventory becomes when sold.
At a typical manufacturer, inventory may represent perhaps 10% of total assets. At a service provider, if it reports inventory at all, it may be even less. Cost of sales, on the other hand, easily comprises 50% or 60% of a manufacturer's total expenses. At a service provider, it is often considerably more.
Inventory is expensive. Inventory ties up capital. Consequently, most industrial companies go to great lengths to keep inventory low. So, when it comes to reporting inventory on the balance sheet, there is not much to report, especially as many companies like to clear out old stock right before they take physical inventory to minimize the time and effort this task wastes.
Obviously, as with any general rule, exceptions exist.
Some companies, particularly those that buy commodities, have vast stockpiles because, as everyone knows, when commodity prices fluctuate unpredictably, buying vast quantities when the price is right makes sense, or one could simply enter into a derivatives contract, but that is a different issue.
In any event, most companies do not buy commodities. Most companies buy semi-finished goods, the suppliers of which are happy, with gentle persuasion, to deliver just in time.
While not impossible, for example a provider of repair services may have some spare parts inventory, most service providers do not recognize or report inventory. Instead, they capitalize service costs as contract assets or accruals.
Cost of sales is the broadest, comprising both cost of goods sold and cost of services rendered. Cost of goods sold may also be broken down into cost of products sold and cost of merchandise sold.
However, as they are most common, only COS and COGS are universally recognized acronyms.
Note: FASB XBRL uses a Cost of Revenue (CostOfRevenue) in place of Cost of Sales (though it does include a CostOfSalesMember). It then disaggregates Cost of Revenue into Cost of Product and Service Sold (CostOfGoodsAndServicesSold) items such as FinancingInterestExpense or PolicyholderBenefitsAndClaimsIncurredNet. IASB XBRL does include a Cost of sales (CostOfSales) item. It also goes into some, althogh diffrent, detail CostOfMerchandiseSold, CostOfPurchasedEnergySold, CostOfSalesHotelOperations, CostOfSalesFoodAndBeverage, CostOfSalesRoomOccupancyServices, etc.
Similarly, from the user's perspective, inventory means nothing. Cost of sales means everything.
Assuming these two companies are otherwise comparable:
Same industry, customer base, and product type.
Obviously, in a real-life scenario, a deeper analysis of the expense structure would be critical. Particularly, it would be necessary to determine if the difference was not caused by research and development or similar, future-useful costs (e.g. sales or perhaps marketing).
While such an analysis is effortless for entities applying US GAAP, it is practically impossible for entities applying IFRS, unless domiciled in a jurisdiction that requires information beyond that required by IFRS itself.
To codify best practice, from 12/16/2026 ASC 220-40-55-11 mandates a granular breakdown of expenses on the level of this illustration:
Editorial comment: while certainly not the only cause, the relative friendliness/unfriendliness of the regulatory environment towards individual investors, investors lacking special privileges, helps explain the relative underperformance of non-US capital markets versus US capital markets, where individual investors feel confident in a level playing field. This is particularly evident in the EU, which has the unenviable track record of being regulatory-friendly towards a select segment of the investing community while leaving the remainder, particularly individuals, with such limited access to actionable information that they feel compelled to entrust their capital allocation decisions to institutional investors. Most regrettably, this preferential treatment of a select investor class shows no signs of being adjusted in the near future.
If it did, the European Commission, as the single largest contributor to the IASB's budget with influence over its decision-making process beyond what the EU's global economic significance would suggest, could have encouraged the standard setter to include guidance comparable to ASC 220-40-55-11 in IFRS 18. It did not. So while IFRS 18 aimed to bring IFRS reporting requirements into the twenty-first century, it ultimately fell short of the mark.
|
|
ABC |
XYZ |
|
Cash |
6 |
7 |
|
Receivables |
8 |
8 |
|
Inventory |
6 |
5 |
|
PP&E |
80 |
80 |
|
Assets |
100 |
100 |
|
Payables |
10 |
10 |
|
Debt |
40 |
40 |
|
Equity |
50 |
50 |
|
Liabilities and equity |
100 |
100 |
|
Revenue |
100 |
100 |
|
Cost of sales |
60 |
40 |
|
Gross profit |
40 |
60 |
|
Administrative expenses |
30 |
50 |
|
Net income |
10 |
10 |
An auditor would likely reach a conclusion such as this.
A common misconception is that auditors and accountants are locked into an adversarial dichotomy.
Assuming both are reasonable professionals, this is not the case. While auditors tend to approach their tasks with a more detached view and clinical precision, they share the same goal as accountants: ensuring the financial report paints a faithful portrait of a company's financial position and results.
Put another way, both seek to ensure that the individuals charged with administering a company's assets (management) are held accountable to those contributing those assets (shareholders and creditors).
Since they share this common aim, seasoned auditors and seasoned accountants typically find common ground and collaborate to ensure the company's financial reports serve their intended purpose.
While this generalization generally holds up in an IFRS | US GAAP context where IFRS | US GAAP generally exist to inform investors and creditors, it may break down in jurisdictions where national GAAP generally exists to establish taxable income.
In these jurisdictions an auditor's insistence on an overly rigorous application of accounting law can have the effect of maximizing taxable income and tax expense. For this reason, the working relationship between accountants and auditors in such jurisdictions is generally less collegial than in jurisdictions where this is not the situation.
Executive Summary
A comparative review of ABC and XYZ, two manufacturing entities with comparable asset bases and operating environments, indicates that inventory variances are immaterial. The primary differentiator is cost of sales, which has significant implications for operational efficiency, management effectiveness, and governance-related risks.
1. Inventory and Cost of Sales
The difference in inventory levels between ABC (6% of assets) and XYZ (5%) is not material. Without additional context, specifically cost of sales, inventory disclosures under IAS 2 | ASC 330 offer limited insight into operational performance and may detract focus from more relevant indicators.
Cost of sales is the key difference. ABC's cost of sales stands at 60% of revenue, compared to 40% for XYZ. Given similar supplier and labor pool, this suggests differences in process efficiency, proprietary technology, or management practices. Under US GAAP, a more detailed cost of sales breakdown is required, facilitating direct analysis of these differences. Under IFRS, such granularity is not mandated. If XYZ reports under both US GAAP and IFRS, e.g. for a dual US and EU filing, audit procedures need to address both frameworks. Where IFRS guidance fails to dictate sufficient detail, supplementary procedures, including analysis or estimation, would be necessary to validate conclusions and ensure consistency.
2. Management Assessment
ABC's sustained operational inefficiency, despite comparable resources, indicates potential deficiencies in management effectiveness or operational capability. This is unlikely attributable to lack of education, experience, motivation, or ambition, as such shortcomings rarely coincide with senior management appointments. The root cause likely relates to limitations in strategic decision-making or operational execution. While increased diligence may temporarily mask these deficiencies, they result in persistent underperformance, as evidenced by comparative metrics. Historical data supports management quality as a critical determinant of economic outcomes.
3. Agency Risk and Governance
XYZ, despite superior operational efficiency, reports elevated administrative expenses relative to peers. This may indicate agency risk, where management prioritizes personal interests over those of shareholders. Verification of board approval for any excessive remuneration is essential. Potential for future restitution or corrective action should be monitored unless operational inefficiencies are promptly addressed.
4. Investor Implications and Market Impact
A rational investor may view XYZ's predictable management behavior as less detrimental than ABC's persistent operational shortcomings, which often lead to erratic and value-destructive outcomes.
Recognition of XYZ's operational strengths could attract unsolicited acquisition interest, given typical earnings-based valuation multiples. Acquisitions may be structured via share exchange rather than cash, enhancing financial leverage. Post-acquisition restructuring would likely involve management replacement and redundancy elimination, yielding rapid profitability gains. While beneficial to stakeholders, such events may curtail existing relationships.
Alternatively, the threat of acquisition may prompt XYZ's board to initiate defensive restructuring, implementing efficiency measures to forestall external intervention. Although potentially less effective than a full takeover, this would likely preserve current engagements.
5. Financial Reporting Risk: Expense Classification
Management may attempt to conceal inefficiencies through accounting policy choices, notably reclassifying administrative expenses as cost of sales. Given the scale of cost of sales, such reclassifications may be less conspicuous and obscure operational weaknesses, reducing attractiveness as a takeover or restructuring candidate. Audit efforts should prioritize verifying the accuracy and appropriateness of cost of sales classification to detect potential misstatements.
An investor would, on the other hand, be thinking:
Inventory is pointless.
What is the point in knowing ABC has 1% more inventory than XYZ?
Yes, it is a fact, but what useful information does it bring me? If I don't also look at cost of sales, the information presented on the basis of IAS 2 | ASC 330 is not only useless but, because it can distract me from the real issue, less than useless.
Cost of sales is not pointless.
XYZ is clearly better at its job than ABC.
Since both have access to more or less the same suppliers and labor pool, it has to be the technology. Most likely, XYZ developed its own, while ABC went off-the-shelf so had to plug the gap with brute force. If the companies reported per US GAAP, I could confirm just by looking at the granular breakdown US GAAP requires (above). Under IFRS, I have to guess, but I'm still pretty confident I can guess right.
ABC's management has a fatal flaw.
Let us see, if ABC's management were competent, ABC would be able to manufacture as effectively as XYZ. So, why is ABC's management incompetent?
Could it be lack of education? Hardly, uneducated people rarely rise to top managerial positions.
Could it be lack of experience? Hardly, inexperienced people rarely rise to top managerial positions.
Could it be lack of motivation? Hardly, unmotivated people rarely rise to top managerial positions.
Could it be lack of ambition? Hardly, unambitious people rarely rise to top managerial positions.
Could it be laziness? ...
So, what could it be?
Oh I know, birth defect.
Unfortunately, some people are born with a fatal flaw. This flaw is so fatal education, experience, motivation, ambition and the willingness to work 16-hours 7 days a week do nothing to help. In fact, they make it even more fatal because they hide it until it's too late.
Yes, I realize fatal is binary. But, sometimes, literary flair trumps the desire for linguistic accuracy.
More fatal. I'm not trying to be funny here, it's just that I couldn't actually care less if some company lives, or dies a horrible death. Not my problem. It only becomes my problem if I happen to have bought their shares. At that point I do care. A lot.
So, what is this flaw?
Inadequate IQ.
Combine education, experience, motivation, ambition and work ethic with the inborn inability to achieve the above-par cognitive results expected of successful managers and what do you get? The corporate structure is designed to filter the industrious stupid before they can cause real harm. But, once in a while, the Peter Principle leads all the way to the corner office.
Does anyone remember a company, once America's industrial leader and one of the select few to earn a AAA credit rating? Then, new management took over. Or the company, once America's technology leader. Then, new management took over. Or the company that invented digital photography but then said, 'Nah.' Sometimes the company can bounce back. Sometimes not.
The trick is identifying an idiot before it hits the ticker.
Fortunately, cost of sales never lies. True, sometimes it tells the truth a bit too late, but it never lies.
So does XYZ's, just different.
Sometimes, managers hired to run companies forget who they work for.
Even some exceedingly bright and highly competent managers, managers who run the company brilliantly, like the CEO who took home an extra $600 million, including the $2 million for a birthday bash for his wife, forget the company's profits are not their profits. They are shareholder profits.
BTW, this is also why I hesitate to invest in companies run by founders. When the CEO is also a major shareholder, he or she can almost always get the board of directors he or she desires. So, until they move on, they can drain all the profit from the company (like, for example, the world's richest man continually tries to do).
The flip side, when a founder leaves and professional management takes over, the company's vision may become clouded. It may forget who it actually serves. As a result, it may set off down the path to short-term profits speculators so love.
Not that I'm pointing fingers, but submerging users in unsolicited, superfluous, irrelevant search results to the point of fatal respiratory impairment is not a sustainable business model. Anyone remember Myspace?
But I digress.
Can a penchant for thievery be fixed, or is this flaw as insurmountable as stupidity?
Personally, I don't think it is possible to remagnetize a faulty moral compass. It can be punished, and investors restituted (if lucky), but people do not change. Once a thief, always a thief.
Time to load up on some options.
As any rational investor knows, no cure for either insufficient IQ or faulty moral compass exists.
But, unlike an idiot, a thief one can work with. Not only are they smart enough to know not to steal too much, but they will act consistently. And predictability has value.
Idiots, on the other hand, being idiots, act like idiots. This makes them unpredictable. About the last thing one wants to see coming over the Bloomberg screen is that management's latest, greatest idea: let's spend $11.1 billion to buy some Autonomy.
But that is not the real issue.
Assuming the outlined above information became known. A big if, but if it did, a third company, say DEF, may decide XYZ's manufacturing prowess is worth having.
So what could DEF do? Buy XYZ. And, it would not even have to pay very much since corporations tend to trade at multiples of reported earnings.
The point of a hostile takeover is that the acquirer does not ask the acquiree if it wants to be acquired. It simply makes the acquiree's beleaguered shareholders an offer they will not refuse.
If that offer involves the ability to trade those dog-eared XYZ shares for some shiny, newly minted DEF shares, all the better. Why waste cash. Cash has to be earned first.
5 minutes later, a corporate restructuring is initiated. Skip ahead 60 more minutes and XYZ's previous CEO is on the sidewalk looking in and, as if by miracle, profit at DEF's new, XYZ division jumps 20%.
Fast forward another several weeks or perhaps a few months, the restructuring aimed at eliminating all remaining administrative redundancies is complete, and XYZ division profits settle at, miraculously, 60% of sales.
Then, since DEF's management had demonstrated its acumen for M&A, the next time it finds a suitable target, it will be able to count on shareholder support, at least for a while.
At many companies, the CEO's core talent is not running the business but finding and acquiring suitable targets.
On the one hand, this can create value for both customers and shareholders, as administrative overlap is relatively easy to remove. Likewise, sales, marketing and R&D can often be streamlined, integrated and made more efficient.
On the other hand, acquisitions, and especially the bootstrapping they can bring, can become so addictive that management cannot stop at only suitable targets, as any former WorldCom shareholder can certainly remember.
Not that this happens particularly often.
The more likely scenario, XYZ will restructure.
Sitting on a board of directors of a corporation is great work if you can get it. If XYZ is taken over, what use could the acquirer possibly have for the acquiree's board of directors?
This is when survival instinct kicks in.
Faced with impending doom, XYZ's board's independent members will hold an emergency meeting. 5 minutes later...
From an investor perspective, a restructuring is not as good as a takeover, but still better than nothing.
From the former CEO's perspective, same difference.
Note: assuming I was confident in my analysis, I would probably buy options to maximize profit even though the downside would be worse.
Problem is, getting to this information is tough.
Being bright, XYZ's management is aware that if investors find out… well, Dennis Kozlowski could give a firsthand account of what can happen, though I doubt he is in a talking mood.
So what can management do?
Magic wand.
A magic wand so potent it can turn a looter into an idiot.
A magic wand so unstoppable it keeps everyone at a distance, like an obviously drunk driver in the fast lane.
A magic wand so simple it takes only a few, well-placed adjustments.
So what is this magic wand?
Reclassification.
Management simply reports expenses that belong in administrative as cost of sales.
Cost of sales is a big number. Adding a little extra admin to it will only make it a bit bigger.
Better yet, it will make the company look like it is run by idiots, best avoided like the drunk in the fast lane.
Some time ago, I was riding my motorcycle in the fast lane (admittedly faster than allowed, but not by that much). Then I noticed headlights approaching at speed. At first, I began contemplating how I would explain my regrettable life choice to an officer of the law, but then those headlights seemed to be behaving erratically, as if they belonged to someone not proficient at operating a motor vehicle.
I changed lanes with haste.
Moments later, those headlights were in front of me, colliding first with one car, then another, then a third before flipping over several times. When it was over, to my surprise, no one died. Yes, the DUI was taken away by ambulance, but that was a good thing. I just hope he had a very long time behind some very strong bars to reflect on his really regrettable life choice.
The point is, whenever, as an investor, I notice a company that seems to be run in a less than proficient manner, I move out of the way. With haste. After all, being an observer to a corporate pileup is better than being a participant in one.
So, in this scenario, the manager can have their cake and keep their job too.
Win. Win.
At least until an accountant with a conscience blows the whistle (or files suit, or resigns), an activist investor with the resources to dig deep digs deep, or a partner rotation brings some new skepticism.
Oddly enough, management also needs to be wary of an industry crisis. If everyone assumes the company will fail and it survives, it will certainly raise some eyebrows somewhere.
Well, except the widows and orphans who get stuck with the ABC stock in the retirement portfolio.
So, why does IFRS | US GAAP skip over the important to focus on the marginally relevant?
Technically, only IFRS completely ignores cost of sales, having no standard that addresses this issue.
The ASC does mention cost of sales. However, its level of indifference is comparable.
ASC 705-10-05-1A (edited): The Overall Subtopic only provides links to guidance on accounting for the cost of sales and services in other applicable Subtopics because the asset liability model used in the Codification generally results in the inclusion of that guidance in other Topics. ...
ASC 705-10-25-1 (edited): This Section consists solely of links to other Subtopics because the asset liability model used in the Codification requires that applicable guidance be included in other Topics. ...
ASC 705-10-45-1: Paragraph superseded by accounting Standards Update No. 2014-09.
ASC 705-10-45-2: Paragraph superseded by accounting Standards Update No. 2014-09.
ASC 705-10-45-3: Paragraph superseded by accounting Standards Update No. 2014-09.
ASC 705-10-45-4: Paragraph superseded by accounting Standards Update No. 2014-09.
ASC 705-10-45-5: Paragraph superseded by accounting Standards Update No. 2014-09.
Because IFRS | US GAAP is built on an asset/liability model.
Under asset/liability model, the guidance focuses on assets and liabilities. Revenue, expenses, gains and losses are relegated to mere changes in assets and liabilities. While it has been criticized and does lead to some counterintuitive guidance, this model has been the foundation for IFRS | US GAAP for some time with no change expected.
Interestingly, even though it is the foundation for the guidance, the ASC only mentions the asset/liability model in passing (ASC 705-10-05-1A) while IFRS does not mention it at all.
Why not? Perhaps because this model is much hated in the professional community (link, local link here link, local link), can lead to hard to interpret and confusing guidance, and is the exact opposite of the income/expense model managers, investors or governments would prefer accounting standards to be based on.
Perhaps, because if they don't talk about it, no one will notice.
Perhaps, because they are whistling past the graveyard.
Perhaps, because it is the right thing to do.
Perhaps, because they can.
Regardless, besides the one tiny slip in ASC 705-10-05-1A, nowhere do the standard setters state they base all their guidance on this much maligned model.
They just do.
Editorial note: while it may seem this page is being critical, it actually supports the asset/liability model even though it does cause confusing and counterintuitive guidance. The reason? To paraphrase Sir Winston, it is the worst possible model, except for all the others. This page also applauds the boards for sticking to their guns in the face of all the hate.
For example, IAS 12 | ASC 740 do not determine deferred income on the basis of income. Instead they determine it on the basis of the tax base of assets and liabilities.
Wait. What?
The tax base of assets and liabilities.
Why? Isn't income tax, as the name suggests, based on income?
Well, yes, it is. But the model used by the IASB | FASB to underpin their guidance requires that deferred tax be calculated the tax base of assets and liabilities, not by simply comparing financial income with taxable income.
Kind of like reaching over your head with your right hand to scratch your left ear.
Yes, exactly like that.
Hmmm. A bit silly. Don't you think?
Theoretically valid is theoretically valid. Stop winging and do with it.
OK
The formal shift from the income/expense model to the asset/liability model in US GAAP was relatively gradual. In 1978, the first FASB Conceptual Statement (SFAC 1) still reflected the income/expense model as the primary basis for financial reporting. However, by the time SFAC 6 was issued in 1985, the conceptual framework had shifted decisively to the asset/liability model. In IFRS, the transition occurred somewhat later. During the IASC's tenure, the income/expense model was prevalent. The transition to the IASB marked the clear shift.
These are broad generalizations, however. The asset/liability model influenced accounting practice well before this. For example, both the topic at hand (IAS 2 | ASC 330) has been firmly grounded in the asset/liability model since inception. Similarly, neither IAS nor IFRS has ever included explicit guidance on cost of sales, while US GAAP has provided guidance in this area it has always been rudimentary.
Importantly, the pursuit of theoretical correctness only constrains the standard setters.
So, while IASB | FASB have to politely ring the doorbell, the practitioner can simply let themselves in through the back door.
For example, a strict interpretation of the letter of IAS 2 | ASC 330 would require delivery costs to be capitalized to inventory. Assume a company acquires 400 items of merchandise and 20 different materials shipped in a single consignment. Per the letter of the guidance, it would need to allocate the shipping to each of those 420 items (true, software can do the heavy lifting, but that is not the point).
Conversely, it would simply expense the shipping through cost of sales (as a variable indirect cost, below) and call it a day.
Would the result be really so different that it would be a material misstatement?
Or, put colloquially, is the juice worth the squeeze.
In other words, does the cost associated with pedantically applying the letter of the guidance justify the benefit of reporting a result not materially different from a result that could be achieved by an alternative, less formalistic approach?
This, my friends, is an issue best resolved during an honest, after-hours exchange of opinions between the practitioner and the engagement partner. Assuming both are rational and reasonable professionals, assuming the amounts involved are not material the cost/benefit constraint provides both sides with ample flexibility to reach a mutually acceptable compromise.
So, if one can arrive at the same destination by either taking a tunnel or driving over a mountain, which makes more sense?
As a bonus, since financial statement users prefer the income/liability approach anyway: Win - Win.
Unfortunately, not all practitioners see it this way.
On the preparer side, practitioners generally prefer procedures requiring minimal effort, while achieving the intended objectives. On the auditor side, there is often a predilection for pedantic adherence to the strict wording of the guidance, even if it leads to irrationally complex, convoluted processes and results in unnecessarily bloated administrative budgets.
Fortunately the cure for this malady is readily available over the counter, and can be administered orally.
Whenever an auditor insists on a cumbersome procedure simply because it is outlined in the guidance, the practitioner may push back by reminding that IFRS | US GAAP aims to address reporting and disclosure requirements, and that any particular procedure is merely a means to that end.
The practitioner can also point out management has flexibility to design internal processes, provided they yield results materially consistent with the aims of the standards. How they achieve this result is less than relevant.
The practitioner can also point out that while auditors have the power to issue qualified opinions, they must justify such opinions not by simply showing how an entity's preferred procedure differs from the procedure outlined in the guidance, but by demonstrating how that difference causes a material misstatement in the financial statements and related disclosures. Barring that, they would need to explain how the additional cost of their preferred treatment justifies the increased administrative burden while only yielding an immaterially different result.
Being rational, when faced with informed and reasonable client resistance, most auditors recognize that insisting on a pedantic application of the letter of the guidance is unjustifiable and adjust their approach accordingly.
Note: the above only applies in an IFRS | US GAAP context. In a national GAAP context, some statutory standard, including many of the national GAAPs drafted as dictated by the EU accounting directive, do prescribe procedures and not adhering to such procedure is subject to criminal sanctions often including, but not limited to, incarceration.
IAS 2 | ASC 330 also shows accounting guidance can be succinct.
Glancing over the guidance on inventory, the image that comes to mind: a ladybug riding a water buffalo.
Printed out, ASC 330 is barely two pages (double spaced). While not as concise, IAS 2 is a pamphlet, not a novel.
Juxtaposed against the labyrinthine and multifaceted pronouncements governing investments, derivative instruments, or fair value measurement, or perplexing and counterintuitive guidance pertaining to deferred tax, girth and mind-numbing complexity makes even the seasoned practitioners shiver with dread, IAS 2 | ASC 330 are like a ray of sunshine on an otherwise cloudy day. That is until one realizes that terse pronouncements necessitate substantial interpretative evaluation.
For instance, the exclusionary provisions articulate that "Other items such as abnormal freight, handling costs, and amounts of wasted materials (spoilage) require treatment as current period charges rather than as a portion of the inventory cost." This terse directive lacks definitional clarity regarding the term "abnormal," omits a prescriptive criterion delineating "abnormal" from "normal," and fails, perhaps most frustratingly, to elucidate the appropriate categorization for said costs beyond dictating their exclusion from inventory valuation. Consequently, ambiguity persists as to whether such costs may be presented as a sub-classification of cost of sales, presented utilizing a mezzanine reporting scheme between cost of sales and gross profit, subsumed by selling or distribution, aggregated with administrative or perhaps general expense, presented in the obtuse other expense section or simply reported as a loss, ambiguity which must be surmounted by a copious application of professional evaluative reasoning and a not insignificant quantity of prudent discernment.
Thus, in the absence of detailed and prescriptive procedural guidance, practitioners must remain cognizant that informed discretionary assessment must be applied and supported, especially when the assessment must be justified to often skeptical audit or regulatory professionals, or perhaps judicial authorities if the issue escalates sufficiently.
Thus unfolds the inherently difficult and complex cognitive landscape necessitated by principles-based guidance, which purposefully eschews detailed and prescriptive criteria which, by eliminating procedural ambiguity, may serve as a perceptual prosthesis for practitioners who preference unequivocal and prescriptive governance protocols that, while constricting autonomous prerogative, do ameliorate the hazard inherent in formulating and justifying unmandated accounting policy.
Obviously, we jest, but brevity does have a downside.
Why so terse? It harks back to a simpler time, when standard setters assumed judgment could fill in the details.
Keeping track of items acquired with the intent to re-sell has been necessary since long before Luca Pacioli made his contribution to our profession. So, when the Committee on accounting Procedure penned the first Accounting Research Bulletin, they had a rich history to draw on and simply assumed, since everyone already knew how to account for inventory, a few words would be sufficient. When the FASB took over, they assumed, since everyone already knew how to account for inventory, those few words would be sufficient, so just carried them forward.
IAS 2.8 specifies that inventories are goods purchased and held for resale. ASC 330-20 goes a step further emphasizing, to be recognized and reported as inventory, an item must have been originally acquired with the intent to resell.
ASC 330-20 (edited) states: ...[the] definition of inventories excludes long-term assets subject to depreciation accounting , or goods which, when put into use, will be so classified. The fact that a depreciable asset is retired from regular use and held for sale does not indicate that the item should be classified as part of the inventory...
Put simply, an asset originally acquired for use not sale may not ever be classified as inventory, even if the entity decides to sell it.
This implies, for example, spare parts acquired to be consumed while providing services are classified as inventory, while spare parts held for repairing machinery or equipment are not, despite both often being called "spare parts inventory."
This interpretation is further reinforced by IAS 16.8, which was added to address previous misinterpretations and misuse of the term "spare parts inventory."
Similarly, if an entity constructs buildings for resale to any customer, they are inventory, subject to IAS 2 | ASC 330. But if it constructs them for its own use, they are PP&E subject to IAS 16 | ASC 360, while if it constructs them for a particular customer, they are projects (contract assets) subject to IFRS 15 | ASC 606.
On completion, the entity would cease applying IAS 2 and begin applying IAS 40.
Note: as US GAAP does not allow the remeasurement of non-financial assets (except industrial or agricultural commodities subject to ASC 330-10-35-16) to fair value, it has no counterpart to IAS 40 whose key requirement is that fair value of investment property must always be determined so it can be either disclosed or reported.
As it started drafting standards a half-century later, the IASC did add a few extra words, but not that many. When the IASB took over, they assumed, since everyone already knew how to account for inventory, those few extra words would be sufficient, so just carried them forward.
Note: true, the FASB did revisit the accounting for inventory, back when converging with US GAAP and IFRS was still on the agenda, but it only added a paragraph or so, then called it a day.
While a welcome respite from sheer mass of recent pronouncements, this brevity is a double-edged sword
The downside of succinct guidance is, well, it is succinct.
For example, IAS 2 | ASC 330 prohibits abnormal freight, handling and wasted material from being recognized as inventory but fails to provide any criteria for distinguishing "abnormal" from "normal." Similarly, beyond prohibiting the inclusion of "abnormal" items in inventory, it does not provide any guidance on how abnormal items are to be treated. May they simply bypass inventory but be included in cost of sales? May they bypass cost of sales and be reported in the mezzanine between cost of sales and gross profit? Should they be reported as sales or distribution expenses? Should they be included in administrative expenses or general expenses or other expenses? May they be simply written off as losses?
The guidance does not specify.
So, how does the practitioner determine what abnormal is and what should be done with it?
Judgment.
Judgment will be second-guessed. First by management. Then by auditors. Then by regulators. Then, if the issue escalates sufficiently, at court and, if one is extremely unlucky, by jury comprising a cross-section of the general population who would probably not recognize judgment if it kicked them in the shins.
So, welcome to the joy ride that is principles-based guidance. Don't forget to fasten your seat belts.
Inventory comprises:
Merchandise is any item acquired for resale without modification.
While minor modifications, such as dealer-installed options in automobiles, may occur, merchandise is generally sold in the same condition in which it was bought.
The primary value added by the retailer or distributor lies in logistics and market access: relocating merchandise to a suitable sale point, locating potential buyers, facilitating transactions, and above all, providing a satisfying buying experience.
Consequently, the accounting for merchandise goes from simple and even simpler.
For entities that have invested in automation such as barcode, QR code or RFID tag scanners, the MIS takes care of itself, with practically no human involvement necessary.
For entities that prefer the old school, hands-on method, adding beginning inventory to purchases and subtract ending inventory cannot be considered challenging accounting.
True, a physical inventory needs to be taken at least once per period, but that is someone else's job.
The accounting for material is thus simple. When acquired merchandise is recognized with a debit to inventory / credit to a cost (cash, accounts payable, etc.). When control passes to the customer, merchandise is derecognized with a debit to cost of goods sold / credit to inventory.
Like merchandise, material is acquired to be re-sold.
Unlike merchandise, it must be converted into or added to a product first.
US GAAP has been recently updated (ASC 220-40-50-6) introducing the term "purchases of inventory."
This item comprises raw material and merchandise if taken together. However, if an entity engages solely in manufacturing, it would continue to use the raw materials/direct material labels. Similarly, a retailer would continue to refer to its inventory as merchandise. While an entity that does both could use a "purchases of inventory" label in its reports, such an entity would likely report its cost of products sold separately from its cost of merchandise sold. So, in practice, "purchases of inventory" is neither an appropriate accounting title nor financial statement line item. It is simply the term the standard setter uses to refer to material and merchandise with a single descriptor.
Note: IAS 1 and IFRS 18 refer to "raw material" expense as a component of cost of sales. It is also uncommon for entities reporting under IFRS to disaggregate cost of sales into detailed component parts for presentation or disclosure purposes. While materiality can overcome this practice, a detailed breakdown of cost of goods sold is fairly rare in the IFRS context.
Also note: materials or supplies consumed during the manufacturing process would also fall into the "purchases of inventory" | "raw material" categories. However, good practice is recognizing these items as production supplies and reporting them in the manufacturing overhead (indirect costs) component of cost of sales (if cost of goods sold is reported on a disaggregated basis).
Material falls into two general categories:
- It becomes part of the product being produced.
-
It is consumed by the production process.
Unlike raw material, production supplies do not become a physical part of products. Instead, they are consumed during the manufacturing process.
From an accounting perspective, while they are rarely material enough to be reported as a separate balance sheet line item, when a product is sold, production supplies are included in cost of sales as variable indirect costs (production overhead), separate from material. This distinction is important when cost of sales is reported in granular detail.
Production supplies generally comprise consumables, such as lubricants, and often small parts like fasteners, capacitors, or resistors. The key accounting difference between a raw material and a production supply is that manufacturers typically track raw material through production, recognizing it first as raw material, then in work in process, and later in finished goods. Finally, when the finished goods are sold and revenue recognized, the raw material is derecognized from the balance sheet and recognized on the profit and loss | income statement as part of cost of sales. Production supplies, in contrast, generally bypass these intermediate steps, moving directly from inventory to cost of sales as they are consumed.
This also means the definition of production supplies is entity-specific. While many companies may calculate their screw expense by simply summing a period's screw purchases (making sure to subtract beginning screw inventory and add back ending screw inventory), others may meticulously track every single screw, especially if those screws involve expensive materials, specialized tooling, and highly skilled workers.
At the other end of the spectrum, some companies treat low-value (a.k.a. small assets) like production supplies. While it is fairly common to expense wrenches or spanners as if they were screws, some companies will apply the same policy to any asset costing less than $5,000 even if that asset is a portable drill press or PC.
National GAAPs, particularly if they are legalistic, set explicit monetary limits for asset capitalization. While neither IFRS nor US GAAP set such limits, this issue did come up during the deliberation process of IFRS 16 | ASC 842 where the boards addressed the staff's concerns regarding "small assets," the way many national GAAP refer to low-value items.
This issue was considered sufficiently important that the IASB decided to include a low-value (small) asset exception in IFRS 16. While the standard itself does not provide a quantification, in the basis for conclusions $5,000 was mentioned as a reasonable threshold.
As this is the only guidance that provides a similar quantification, even though it cannot be considered authoritative, it has become the basis for common practice when evaluating (by analogy) any "small asset."
Since ASC 842 does not include a 'small asset' exception similar to IFRS 16, analogizing from ASC 842 is not an option under its guidance. Nevertheless, since the ASC 842 Basis for Conclusions mentions the same $5,000, $5,000 is commonly used as a rule of thumb for "small" in US GAAP as well.
Thus, when applying this guidance, a company would need to test whether its aggregate "small assets" (not just those acquired in the accounting period but) do not cross a materiality threshold. If, for example, it can be reasonably assumed the company actually has "small assets" exceeding 1% of total assets, some of those assets will need to be capitalized to make sure that no material misstatement is being made.
Note: the same test would also need to be performed in IFRS because the $5,000 threshold only applies to small assets being leased, not small assets in general.
Thus, while not widely used common practice, this guidance is used to justify expensing items, such as personal computers or light machinery and equipment such as compressors, welders, portable drill presses, provided the per item cost does not exceed 5,000 USD. This issue is discussed in more detail in the Consumables (small, low-value assets) section of this page and Small assets section of this page.
As the guidance provided by IAS 2 | ASC 330 is rudimentary, it leaves significant room for professional judgment, and imagination, to be applied.
However, the accounting for material is equally as simple as the accounting for merchandise.
Technically, strict adherence to the guidance would result in a different. Rather than being derecognized with a debit to cost of goods sold, it would be derecognized with a debit to WIP. However, as running costs through inventory can be more work than it is worth, simply expensing it as it is consumed (perpetual method) or once per period (periodic method) is usually close enough. A more detailed discussion of why it is usually good enough is provided above.
The accounting for products is somewhat more involved than the accounting for merchandise and material.
The default method of accounting for production is full absorption costing.
While IAS 2 | ASC 330 does not use the term "full absorption costing" but does require it. Specifically:
Black letter IAS 2.23 states: The cost of inventories of items that are not ordinarily interchangeable and goods or services produced and segregated for specific projects shall be assigned by using specific identification of their individual costs.
While similar, ASC 330-10-30-10 is not nearly as categorical stating (edited): ... While in some lines of business specific lots are clearly identified from the time of purchase through the time of sale and are costed on this basis, ordinarily the identity of goods is lost between the time of acquisition and the time of sale.
Nevertheless, under both, if an entity is capable of clearly identifying inventory costs as a product moves from raw material to finished good, it shall do so, reinforcing full absorption costing as the default accounting method.
However, given the practical difficulties of applying this method in the real world, particularly in serial manufacturing, both IFRS | US GAAP (specifically IAS 2.21 | ASC 330-10-30-12) explicitly allows standard costing, which is considerably simpler from an accounting methodology perspective. Similarly, IAS 2.21 | ASC 330-10-30-13 allows retailers to use a simplified, retail method.
In practice, entities often use other methods not explicitly mentioned in or allowed by the guidance. A good example is direct costing but various other hybrid methods are also used.
Direct costing is a common, internal method not generally appropriate for IFRS | US GAAP reporting purposes. However, if adjustments reflecting indirect costs are made, it could be used. As these adjustments need only be made periodically, it would be considerably simpler than tracking these costs as products move through the manufacturing process.
Examples include activity-based costing (ABC), throughput accounting, marginal costing, lean accounting , resource consumption accounting (RCA), target costing, etc.
However, for any method to be acceptable from an IFRS | US GAAP perspective, the result must be consistent with full absorption costing, ensuring that reported cost of sales includes direct material, direct labor and indirect production costs, both fixed and variable.
The costs fully absorbed to inventory comprise:
In US GAAP financial reports, a granular breakdown of cost of sales (cost of goods sold if only products are involved) in the footnotes is required.
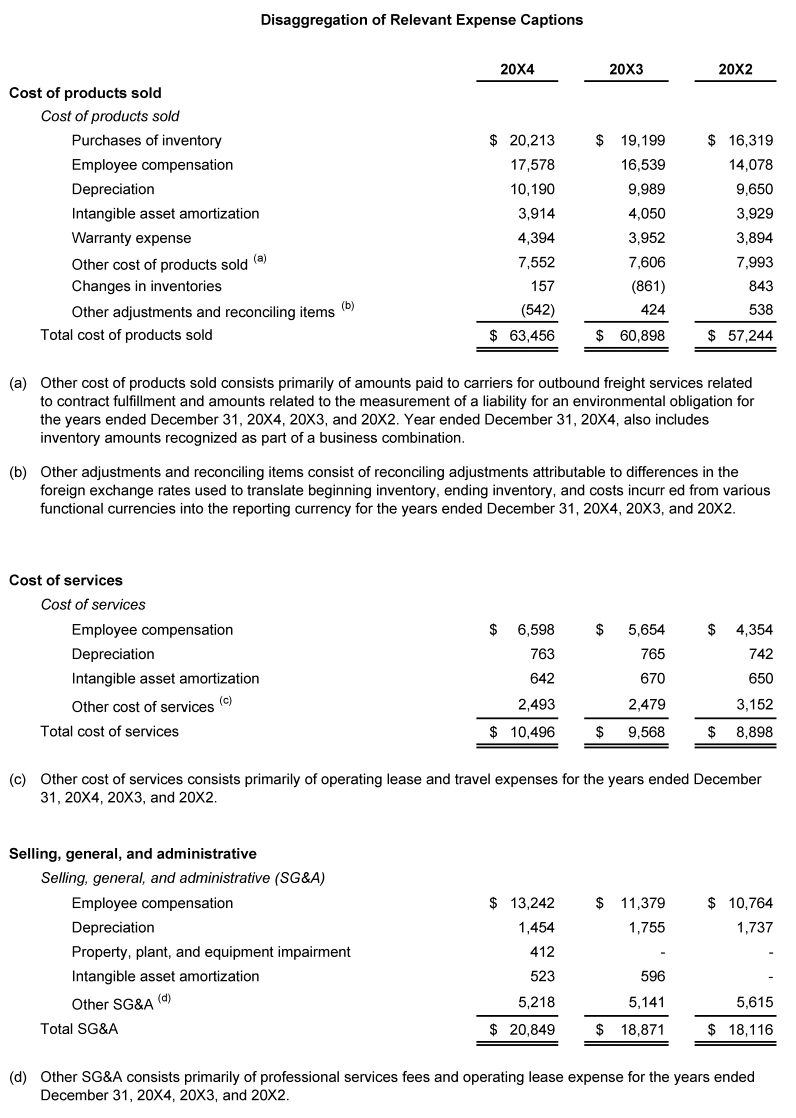
ASC 220-40-55-11 includes the following illustration of how to apply ASC 220.
As this example clearly illustrates, the guidance requires a granular disclosure of various expense components. For example, a disaggregation of cost of goods sold is required (from December 16, 2026).
This reporting approach is less common in IFRS. Nevertheless, if the individual components of cost of sales are material, an auditor may require this granular information due to Practice statement 2.
However, PS 2.4 states: The Practice Statement provides non‑mandatory guidance; therefore, its application is not required to state compliance with IFRS Standards.
This implies that an auditor cannot insist on a granular breakdown of cost of goods sold, or any larger expense item, if a standard or interpretation does not require it, which neither does.
- Direct costs
Material out of which a product is manufactured or that becomes a physical part of a product.
Direct material is what becomes of raw material when it moves from inventory to cost of goods sold.
Employee benefits accruing to employees directly involved in the production of product (rendering of services: below).
These typically include wages and costs such as overtime, social security taxes, health insurance, safety and hazard insurance, meals, clothing, work aids, etc. They may not, however, include any employee benefits for any activity besides production as discussed in the excluded items section further down this page.
- Direct material
- Direct labor
- Indirect costs (manufacturing overhead)
Commonly, depreciation, amortization and rent. Fixed costs may also include, for example, royalty payments, supervisor salaries and other costs that do not change with production volume.
Note: costs do not need to be linear to be fixed. For example, depreciation determined using a diminishing balance method would be a fixed cost even though it is not a straight line expense. The key distinction between fixed and variable costs is that the former are not correlated with production volume while the latter are.
Variable costs change together with production volume. The correlation need not be exact, but it must exist. If it does not, they the costs are fixed, not variable.
variable costs most often comprise factory (production) supplies, consumables (small tools not capitalized), repairs and maintenance (MRO), quality control and inspection, utilities (electricity, fuel, water, sewage, waste removal, etc.) or setup and re-tooling.
As outlined in IFRS 18.80 | ASC 220-40-50-6, an entity should recognize "raw material" | "purchases of inventory," which generally includes materials or supplies consumed during the manufacturing process. Nevertheless, it is good practice to classify material consumed in the production process as manufacturing overhead (indirect costs) instead of including it in direct material.
While this distinction is not explicitly mandated by IFRS | US GAAP, it is widely accepted and appropriate for accurate cost allocation and reporting.
Some entities treat low-value (also known as small) assets like production supplies, expensing them as they are acquired. This practice is particularly common in jurisdictions where national GAAP sets explicit monetary limits for asset capitalization. While neither IFRS nor US GAAP sets explicit universal thresholds for capitalization, the concept of "low-value" assets was discussed during the development of IFRS 16 | ASC 842, with a value of approximately $5,000 cited as a practical benchmark in the Basis for Conclusions of both standards. Although this amount is not a formal capitalization limit under either framework, it has become a widely accepted practical threshold when making capitalization versus expense judgments.
This site does not recommend expensing assets solely based on acquisition value. Instead, it recommends capitalizing such low-value assets using group or composite depreciation methods, as discussed on this page.
Quality control generally refers to the overall process of ensuring that products meet quality standards, while quality inspection specifically involves examining products or processes to detect defects. Both activities are typically classified as indirect production costs.
As a rule, setup and tooling costs are included in the acquisition cost of the item(s) of PP&E when those items are initially recognized. Once such item(s) have been initially set up, any subsequent setup and retooling costs cannot be capitalized to PP&E but should instead be capitalized to inventory and allocated to the related production run.
Depending on how production is organized and personnel compensated, they may or may not include costs such as supervisor or production manager salaries. However, regardless of their composition, care must be taken that variable costs never include any of the excluded items discussed further down this page.
As such, this page addresses both the accounting for receivables and revenue recognition simultaneously.
With respect to revenue recognition, the two key issues are timing and amount.
Both of these are discussed on this page.
However, as the timing of revenue recognition coincides with the timing of inventory derecognition, an additional discussion of this issue is provided on the inventory page.
- Fixed
- Variable
Including services on this list always raises eyebrows. But it does have, albeit tenuous, support in the guidance.
IAS 2.6.c (edited, emphasis added): Inventories are assets: ... in the form of materials or supplies to be consumed in the production process or in the rendering of services | c To be currently consumed in the production of goods or services to be available for sale.
ASC 330.20.c states: Inventory: The aggregate of those items of tangible personal property ... c To be currently consumed in the production of goods or services to be available for sale.
While this IAS 2 specifically refers to materials or supplies IFRS 15.91 to 98 specify that both incremental costs of obtaining a contract and costs to fulfill a contract must be capitalized. This guidance applies all entities manufacturers and service providers alike.
Similarly, those ASC 330 specifically discusses items of tangible personal property, ASC 606-10-15-5 mentions and ASC 340-40-25-1 to 8 provides comparable guidance.
Given that revenue guidance is considerably more modern than inventory guidance, a more flexible interpretation of the latter is justified.
More importantly, the argument that accrued service costs may not be included in inventory because services lack physical substance misses the point.
As discussed above, inventory is not the point. Cost of sales is the point.
Put less simply, giving due consideration to the materiality constraint, coupled with the incontrovertible fact that all costs related to the provision of services are ultimately subsumed within cost of sales, service providers may, with a degree of justifiable latitude, elect to construe the antiquated and arguably obsolete guidance pertaining to inventory through the interpretative prism afforded by the contemporaneously updated revenue recognition standard, namely IFRS 15 | ASC 606. Determined by analogy, the policy of capitalizing all costs directly related to revenue into a single asset item—rather than dispersing them among various disjointed assets—thereby eschewing the historically arbitrary bifurcation predicated upon the archaic goods versus services dichotomy, the abrogation of which constituted one of the principal objectives of the comprehensive project culminating in the issuance of IFRS 15 | ASC 606, a standard promulgated expressly as a wholesale replacement for IAS 18 | ASC 605, rather than as a mere incremental amendment, reflecting the broader recognition that antiquated accounting infrastructure frequently necessitates wholesale demolition and replacement, not mere cosmetic renovation or superficial rebranding, would be justifiable.
Be that as it may, the juice is probably not worth the squeeze?
While the above argument should be sufficient to convince even the most pedantically inclined auditor to accept the policy, is it worth the effort?
As a general rule, practitioners only have so many matches. Is it worth burning one just to prove a point?
Put another way, is tilting against the pedantic predilection to apply irrational and outdated guidance verbatim worth the time and, since auditors often bill by the hour, expense?
As a wise man once said: Más vale buen acuerdo que buen juicio.
So if the auditor balks at including accrued service costs in inventory and would rather see them recognized as accruals, why not make them happy and acquiesce?
Note: the above only applies to basic, point-of-time services or those measured cost-plus. More complex services, accounted for as projects, fall into the contract asset category outlined in IFRS 15 | ASC 606. A more detailed discussion of this issue is provided in the Percentage of completion (over time) section of this page.
- Merchandise
- Material
- Products
- Services
On the balance sheet inventory is classified:
The balance sheet recognition of merchandise generally aligns with the description of merchandise (above).
However, additional points need to be made:
-
While the cost of merchandise is always capitalized, the costs associated acquiring merchandise (locating sellers, shipping, handling, storage, etc.) are often expensed (as cost of goods sold) as incurred, even though this policy would not be consistent with the letter of the guidance (as discussed above).
-
While neither the IASB nor FASB XBRL taxonomy considers merchandise sufficiently material to be included on a standard balance sheet, both include it in the footnotes as Merchandise and RetailRelatedInventoryMerchandise respectively.
-
Since merchandise is specifically mentioned in the guidance (IAS 2.8 and 37 | ASC 330-20), if it represents 5% or more of total assets, it would need to be presented as a separate, balance sheet line item. A supplement discussion on how to determine materiality is provided on this page.
-
As the accounting for merchandise is practically indistinguishable from the accounting for raw material, the two are often reported as a single line item even though they would be recognized in separate COA accounts.
The balance sheet recognition of raw material generally aligns with the description of material (above).
However, additional points need to be made:
ASC 220-40-55-11 illustrates how the guidance provided by ASC 220 would be applied to various income statement items. Although an illustration, unlike IFRS where illustrations are not considered core guidance, the ASC makes no distinction between illustrations and its remaining guidance. This implies that the disaggregation outlined below is mandatory. What is not, however, mandatory are the exact line ites that will comprise the disaggregation. Obviously, as each entity will have different material expenses or groups of expenses, a one size fits all list is not possible. Which is also the reason the guidanc is presented as an illustration rather than a comprehensive list.
IFRS provides no specific guidance requiring a detailed level of disaggregation similar to that found in ASC 220-40-55-11. Nevertheless, since all material items must be disclosed as outlined in IFRS Practice Statement 2, auditors may require comparable disaggregation. Auditors also have the authority to issue a qualified opinion if material disclosures are omitted.
Note: research conducted by the author of this page for an auditor client indicated that this level of granular disclosure is relatively rare among entities subject to EC 1606/2002. This observation suggests inconsistency in how auditors interpret and apply IFRS Practice Statement 2 in the EU context.
Also note: the engagement mentioned in the previous note did not require a statistically representative sample nor academic rigor. Therefore, the conclusions presented here should not be given the credence reserved for peer-reviewed research. Specifically, readers of this page are advised to either repeat the research for themselves or seek out peer-reviewed research.
-
While the cost of raw material is always capitalized, the costs associated acquiring raw material (locating sellers, shipping, handling, storage, etc.) are often expensed (as cost of goods sold) as incurred, even though this policy would not be consistent with the letter of the guidance (as discussed above).
-
While the FASB XBRL taxonomy considers raw material sufficiently important to be included as in item on a standard balance sheet (InventoryRawMaterialsAndSupplies) and reported in the footnotes (InventoryRawMaterials), IASB XBRL only reports it in the footnotes (RawMaterials).
-
Since material is specifically mentioned in the guidance (IAS 2.8 and 37 | ASC 330-20), if it represents 5% or more of total assets, it would need to be presented as a separate, balance sheet line item under both IFRS | US GAAP. A supplement discussion on how to determine materiality is provided on this (page).
-
As the accounting for raw material is practically indistinguishable from the accounting for merchandise, the two are often reported as a single line item even though they would be recognized in separate COA accounts.
-
Raw material transforms into the direct material component of cost of goods sold when finished goods are transferred to a customer. An additional discussion of this issue is included in the following sub-section.
Interestingly, ASC 330 uses the term work in process, which accurately describes the manufacturing process of transforming raw materials and supplies into finished products.
In contrast, IAS 2 uses work in progress, which more suitably describes the progress a building makes from foundations to finished structure.
In practice, the acronym WIP solves the problem with little fuss.
At the risk of belaboring the point, a small subset of practitioners delight in often gratuitously nuanced disputations regarding the precise semantic fidelity and philological exactitude of arcane and highly specialized terminological constructs, particularly when interacting with similarly inclined cohorts who manifest an almost compulsive fixation upon the literal and verbatim phraseology enshrined within extant authoritative guidance. There concurrently exists a divergent faction of professionals who consciously eschew such lexical fastidiousness in favor of concentrating their intellectual and practical energies upon matters of substantive import and pragmatic consequence.
The former argue about whether to call it work in process or work in progress. The latter simply say WIP.
The term finished goods is self-explanatory. It denotes goods that are finished.
- Merchandise
- Raw material
- WIP
- Finished goods
On the profit and loss statement inventory becomes:
Previously just good practice, US GAAP requires a granular breakdown of cost of sales .
Reinforcing previous best practice, from 12/16/2026 ASC 220-40-55-11 mandates a disaggregation of expenses consistent with the following illustration:
IFRS, in contrast, does not provide specific guidance on the level of disaggregation required.
As a general rule, a line item is disaggregated if its constituent parts can be separately recognized and are material.
For example, if an entity only sells merchandise, it would only report a single cost of merchandise sold line item even if merchandise represented 70% of total expenses.
In contrast, if the entity sold products, it should disaggregate cost of sales and report, for example, direct material, direct wages, depreciation and other production overhead.
However, IFRS does not mandate the detailed disaggregation required by US GAAP (above).
Instead, materiality, as defined in IFRS 18 (A), guides overall presentation while additional guidance on making materiality assessments, including decisions about disaggregation, is found in practice statement 2.
However, PS 2.4 states: the Practice Statement provides non-mandatory guidance; therefore, its application is not required to state compliance with IFRS Standards. Consequently, auditors may recommend disaggregation based on materiality considerations, but cannot insist on it unless a specific standard or interpretation explicitly requires it.
Thus, unlike under US GAAP, IFRS entities often present considerably less granular cost breakdowns. Reflecting this, the IASB XBRL taxonomy does not include detailed cost components such as direct material (CostDirectMaterial), direct labor (CostDirectLabor) and overhead (CostOfGoodsAndServicesSoldOverhead), like the FASB taxonomy. Interestingly, it does include the cost of merchandise sold item (CostOfMerchandiseSold), even though it omits the broader cost of goods sold item.
Material that has become a physical part of a product (above).
Instead of direct material, a retailer would report merchandise (above).
Employee benefits | wages accrued to workers engaging in production activity.
This issue is discussed in direct labor subsection above.
In an IFRS or US GAAP context, overhead is generally taken as a synonym for indirect production costs and comprises costs such as depreciation of manufacturing facilities or electricity consumed by production machinery.
In a national GAAP context, it is occasionally an arbitrarily determined portion of administrative or general expenses classified as cost of sales at management discretion. While it may be possible to justify allocating some or a portion of some, for example, managerial salaries to production overhead, care must be taken so the guidance provided by IAS 2.16.c | ASC 330-10-30-8 properly and rigorously applied. This is especially important if an international subsidiary primarily applies local GAAP and only makes adjustments to arrive at an IFRS | US GAAP reporting package for its parent.
ASC 330-10-30-8 provides clear and succinct guidance stating (edited): ...under most circumstances, general and administrative expenses shall be included as period charges, except for the portion of such expenses that may be clearly related to production and thus constitute a part of inventory costs (product charges)...
While marginally less direct, IAS 2.16 does specify that administrative overheads that do not contribute to bringing inventories to their present location and condition are excluded from inventory and expensed in the period.
Examples of costs excluded from the cost of inventories and recognised as expenses in the period in which they are incurred are: (a) abnormal amounts of wasted materials, labour or other production costs; (b) storage costs, unless those costs are necessary in the production process before a further production stage; (c) administrative overheads that do not contribute to bringing inventories to their present location and condition; and (d) selling costs.
- Direct material
- Direct labor
- Indirect production costs (overhead)
Production related costs that are not correlated with production volume.
This issue is discussed in fixed cost subsection above.
Production related costs that are correlated with production volume.
This issue is discussed in variable cost subsection above.
- Fixed
- Variable
Inventory excludes:
As outlined in IAS 2.16.c | ASC 330-10-30-8, administrative expenses may not be included in inventory or, more importantly (above), cost of sales.
Also discussed above, the brevity of the guidance means it limits itself to a simple prohibition without outlining any criteria to be used to distinguish costs that may be included versus costs that may not.
Using employee benefits as a proxy, the conservative approach would be to include only wages paid to production workers. This guarantees that only costs clearly associated with production are included.
Next most conservative: including direct wages and supervisor salaries. As work and the supervision of work are inseparable, this is the most common and best approach.
While not particularly popular with management, auditors love this approach.
In contrast, any attempts to include any management compensation will raise eyebrows.
Specifically, to paraphrase ASC 330-10-30-1, is the compensation paid to this member of management directly or indirectly necessary in bringing an article of inventory to its existing condition and location? Are you sure it is?
To quote ASC 330-10-30-8: Also, under most circumstances, general and administrative expenses shall be included as period charges, except for the portion of such expenses that may be clearly related to production and thus constitute a part of inventory costs (product charges).
Are you really sure this compensation qualifies as an exception to this general rule? Are you prepared to prove this compensation qualifies as an exception to this general rule? Are you sure you are not risking a qualified audit opinion just to make management happy? Really, really?
Well then, OK, go ahead.
While comparable, in a seeming role reversal, IFRS is stricter. Instead of being couched as a discussion of a principle, the guidance is a rule:
Black IAS 2.10 (emphasis added) states: the cost of inventories shall comprise all costs of purchase, costs of conversion and other costs incurred in bringing the inventories to their present location and condition.
Grey IAS 2.16 (edited) clarifies: ... excluded from the cost of inventories ... c) administrative overheads that do not contribute to bringing inventories to their present location and condition.
More adventurously: production manager salaries could be included. However, auditor skepticism should be anticipated and sufficient documentation to justify this policy prepared and presented.
The pinnacle: not only intermediate management but the plant manager is included. However, as one ascends the hierarchy, the higher a manager the broader his or her responsibilities, which makes both the justification and bifurcation more onerous. While tools such as the IDI Time Bank can aid the process, but auditors will invariably scrutinize any allocation scheme to ensure that only costs demonstrably associated with production-related tasks are recognized. Developing documentation that provides auditors with irrefutable evidence that the chosen policy complies with both the letter and spirit of IAS 2.16.c and ASC 330-10-30-8 is often so onerous, many entities simply desist.
With the complexities of management compensation duly addressed, applying the same to the remaining costs becomes markedly more straightforward. For example, the fuel, depreciation or repairs associated with a vehicle used to both will-call materials and deliver finished goods would be determined and bifurcated, the former could be capitalized to inventory (or simply expensed, above, to cost of sales) while the latter expensed as selling or distribution.
As outlined in IAS 2.16.d | ASC 330-10-30-8, distribution | selling expenses may not be included in the cost of inventory or, more importantly (above), cost of sales.
Also discussed above, the brevity of the guidance means it limits itself to a simple prohibition, without outlining any criteria to be used to distinguish costs that may be included versus costs that may not.
Fortunately, put colloquially, interpreting this guidance is a no-brainer.
No accountant would ever consider including, for example, salespersons' commissions, distributor rebates, trade show costs, travel, entertainment, or any demonstrably selling expenses in either inventory or cost of sales.
When it comes to distribution or selling costs tied to delivery or shipping, the distinction becomes less clear-cut. But, fortunately, double freight and rehandling have their own, stand-alone guidance.
While not explicitly mentioned by the guidance, double freight is commonly understood to mean the cost of shipping goods to a customer.
IAS 2.11 provides the more understandable guidance stating (edited): the costs of purchase of inventories comprise ... transport, handling and other costs directly attributable to the acquisition of finished goods, materials and services.
While it does suggest services may need to be shipped (perhaps by truck or train), the guidance makes clear that double freight, as it is not directly attributable to the acquisition of finished goods or materials but rather their sale, cannot be included.
In contrast, ASC 330-10-30-7 only discusses abnormal freight and handling costs. Nevertheless, ASC 330-10-30-1 also discusses expenditures or charges directly or indirectly incurred in bringing an article to its existing condition and location, so the guidance is comparable.
The result of applying each guidance is thus comparable: double freight is a selling or distribution expenses and may not be capitalized to inventory or, more importantly (above), expensed through cost of sales.
Like double freight (above), rehandling is a term commonly used in practice rather than by the guidance.
In IFRS rehandling falls under both the general guidance provided by IAS 2.11 and the specific guidance provided by IAS 2.16.b.
In US GAAP, it is not specifically addressed, but falls under same (ASC 330-10-30-7 and ASC 330-10-30-1 ) guidance as double freight.
However, this is just a formality and has no palpable influence on the accounting so it would be treated the same under both sets of guidance.
In general, two types of rehandling occur.
In the first type, a retailer first acquires merchandise from its manufacturer then ships it to a central distribution center, then a regional distribution center, then a local warehouse and finally a retail outlet.
Only the first cost, acquiring the merchandise, would qualify as inventory, or more importantly (above), cost of sales. The remaining costs, transportation, warehouse depreciation (or rent), warehouse staff, etc., are associated with the distribution channel, so recognized as distribution or selling expenses, even if substantial.
In the second type, a manufacturer first acquires material from its producer in country A then ships it to country B where some production steps are taken. It then ships the WIP to country C, where production is finalized. It then ships the finished goods, in bulk, to country D where the finished goods are packaged so they can be offered for sale in country D's language.
As with merchandise, the initial cost is included in inventory or cost of sales. So is the cost of shipping from A to B, and B to C. However, the cost from C to D is expensed. On the basis of what criterion?
The two most commonly used criteria are physical functionality and intended-use.
If the first is applied, the accountant determines where the product becomes physically capable of serving its purpose.
As the packaging in country D has no effect on physical functionality, and is merely done to facilitate the product's sale, the C to D leg is a selling or distribution expense.
However, what if the product produced in C were a television?
It may be possible to mail a memory card in an envelope. However, if a TV is shipped with protective packaging, it will have physical functionality only at the beginning of its journey.
Thus, in this situation, the repackaging is essential to maintaining physical functionality so the C to D leg would be included in inventory or cost of sales.
The question is, why would any accountant, if not an expert on assessing physical functionality, apply this criterion?
In another example, the item produced at C was a car door. This door could either be shipped to country D where production would continue to finished automobile. It could also be shipped to country E, where it would replace a door damaged in a collision.
In this, recognition takes care of itself: the cost of shipping WIP falls into inventory or cost of sales, while the cost of shipping finished goods is a selling or distribution expense. Simple.
Besides requiring no judgment, the intent criterion carries the added benefit of being fully consistent with the logic behind IFRS | US GAAP, even if it leaves some accountants, especially those just starting out with IFRS | US GAAP, shaking their head in disbelief.
IFRS | US GAAP focus on the financial. IFRS even goes so far as to include this word in its title.
In contrast, many national GAAPs focus on the physical. For example, many have an additional "semi-finished goods" inventory category that reflects this perspective.
Specifically, these GAAPs draw a distinction between partially manufactured goods and fully manufactured items. For example, an electric motor would be a semi-finished good, while the washing machine, once the motor (and all the other semi-finished goods) was installed, would be the finished product.
This reflects the assumptions that are the foundation for the guidance.
Under the labor theory of value, economic value is created by combining labor and material with the help of physical capital.
Under the exchange theory of value, economic value is created not by creating a physical thing but by creating something someone wants to buy.
Under the labor theory of value, the distinction between partially created value and fully created value has to be given accounting recognition during the production process.
Under the exchange theory of value, this is irrelevant because no value is created until the moment of sale.
Unfortunately, theory can also influence behavior.
For example, in accounting based on the labor theory, a change in inventory is recognized by debiting inventory/crediting revenue.
This may, and has, led careless managers to assume they are creating value even though they are only producing goods no one will ever buy.
It can also lead to warehouses full of unwanted goods lingering for years, even decades, because, since physical existence has value, testing for net realizable value has no economic foundation.
Under the labor theory of value, accountants also have to examine, for example, where in the production process a product achieves its physical functionality after which no additional value can be added.
In contrast, under the exchange theory of value, the only issue an accountant has to consider is whether the cost was associated with the exchange or not.
To accountants moving from a national GAAP environment to IFRS | US GAAP, it may seem as if something is missing.
It is not. It really is that simple.
As outlined in IAS 2.16.a | ASC 330-10-30-7, abnormal amounts of wasted materials (also known as wastage, spoilage or shrinkage) may not be included in the cost of inventory or, more importantly (above), cost of sales.
Also discussed above, the brevity of the guidance means it limits itself to a simple prohibition, without providing detail to help identify abnormal waste or distinguish it from normal waste. In practice, this gap is filled by the "reasonably preventable" criterion in that, simply being able to avoid wastage does not, in and of itself, make it abnormal.
Thus, being absolutely preventable is not sufficient to tip the scales. The operating procedures, business policy or management technique also needs to be reasonably applicable rather than counterproductive.
For example, consider a manufacturer using steel pipes in its production. The pipes come in a standard length which the manufacturer cuts into usable portions. Each pipe yields five usable portions. The sixth portion is too short and scrapped.
In the real world, scrap is sold. However to keep this illustration straightforward, in its simplified world, scrap has no market value.
To assess whether the waste was normal or abnormal, the manufacturer compares the cost of a standard length pipe (100) with the price (120) of a non-standard length pipe. Assuming the scrap is 10% of the whole, spending 20 to save 10 would not be reasonable so the wastage is normal.
While I have never had a pipe manufacturer as a client, during a training, I discussed this with accountants from a pipe manufacturer. They confirmed that their company hated special orders, which required stopping production, resetting the cutting length and restarting production. While they did do special orders, they only did them for repeat customers and always at a premium (unless the customer happened to order a very unusually large run).
However, the real world is rarely this straightforward.
What if the pipe's producer only wants 110. Placing a special order to save zero is not reasonable: normal.
What if the pipe's producer only wants 109. Annoying suppliers for marginal savings is not reasonable: normal.
In my spare time, I am MD at a company providing programming and support services. Most customers are easy to work with, require reasonable delivery times, are happy even if we use mostly off-the-shelf modules, rarely request rework, and pay on time. Troubleshooting is also straightforward because they clearly identify their bugs.
However, one customer was not like this. Never satisfied, always making special requests, always haggling on price, incapable of identifying problems, and consistently paying late. A nightmare.
As I am merely charged with managing a national branch of a larger entity, I do not have the authority to terminate customers without approval. And this approval is practically never given. But what I do have authority over is the project queue (except for in-house support; that always comes first). I made sure this customer's requests were always at the end of the line. Even if other projects had flexible timeframes, this customer's projects were always last. And if they did happen to get done quickly, I made sure they were tested and retested; unless the programmers had better things to do, in which case they could wait to be tested.
When it came time to negotiating price, I always started with a 50% annoyance premium. Sometimes I would settle for just 25%, but they always paid extra. After all, a reasonable price has to reflect both the aggravation they caused and my time they wasted. When the customer finally decided to switch suppliers, the team cheered.
What if the pipe's producer only wants 105. Special orders do not upset us; 5% is a significant relative to the cost of pipe; no reasonable explanation: abnormal.
To save the effort of quantitative analytical techniques, many administrative workers default to the simplest of all criteria: historical experience.
The argument goes: it was 10% last year; it was 10% the year before that; 10% is normal.
While the historical experience criterion does have its place, for example in estimating future returns and warranty provisions or uncollectible accounts receivable, it is not appropriate for evaluating whether wastage is normal or abnormal.
Unfortunately, as this is not explicitly outlined in the guidance, accountants not adept at interpreting vague instructions only find out after an auditor identifies the error and demands its correction.
The problems with auditors, they may not notice the error right away. As they test, the error may not show on the test unless it gets picked at random or until it becomes too large to ignore. By then it may be too late to fix the error in the current period so IAS 8.42 | ASC 250-10-45-23 becomes applicable. This means going back, sometimes maybe years back, identifying all the affected periods, correcting the accounts and restating the financial reports.
Oops.
Once it has been determined the wastage is abnormal, the wastage must be appropriately classified. The guidance does not specify where the abnormal wastage is recognized. It only specifies that it may not be recognized in inventory and, by implication, cost of sales. However, the waste was caused by insufficient management control over the purchasing function, it would be classified as an administrative expense.
In another situation, a retailer sells, among other items, fresh fruit and vegetables. Wednesday evening the produce purchasing manager is watching TV. The report for the weekend is hot and sunny. Rather than a standard 100 tonne order, the manager doubles down, ordering 200 tonnes. However, the weekend is cold and rainy. Instead of salad, customers stock up pork roast and dumplings.
As the extra 100 is not sold, it must be liquidated. Was this waste preventable?
Yes. If, instead of ordering 200 the manager had ordered 100, it would have been prevented.
Was it reasonably preventable?
Perhaps. If the manager had based the purchasing decision on a stochastic analysis of weather patterns, perhaps utilizing a Monte Carlo simulation to quantify a most likely outcome, while the decision may not have been fully accurate, it would have likely been less inaccurate than if based simply on a TV weather report.
As a company should reasonably expect its managers to use rigorous analysis in their decision making, the wastage was reasonably preventable.
The counter-argument: no stochastic analysis, including Monte Carlo simulations, can fully attenuate potential losses caused by variables of such inherent unpredictability as the weather. Thus, any policy that fails to balance the inherent unpredictability of future events with the need to make managerial decision whose ultimate outcome can only be evaluated in retrospect risks instilling a risk averse mindset which can be almost as destructive for shareholder value as management carelessness.
This puts the accountant in the difficult position of arbitrator. When is an erroneous managerial decision reasonably preventable and when is it not.
Fortunately, this is above the pay grade of practically all accountants. Instead, all an accountant needs to do is flag any erroneous managerial decision. This way, the decision is pushed up the chain of command to a level where its reasonableness can be evaluated by informed senior managers, who can then take corrective action.
The worst thing an accountant can do, allow themselves to be swayed by such arguments, simply classify it as normal waste and call it a day.
I once had a client, a retailer of, among other items, fresh fruit and vegetables. While we were discussing the issue at hand, the conversation turned to why I was there. The new accounting manager had to make sure the policy he was implementing was consistent with the guidance.
Why was he new? Because his predecessor allowed himself to be convinced by the argument that the purchasing department had no control over the weather. Consequently, he failed to flag the wastage as excessive. As such, it remained in cost of sales where, as cost of sales was a large number, the purchasing department hoped it would remain hidden forever. After some time, a team from internal audit arrived. Their concern was the statistically significant anomaly in the cost of sales reported by this location compared to that reported at other, comparable locations. After reviewing the pertinent documentation, the team concluded that the purchasing department had failed to use adequate stochastic analysis of weather patterns, particularly utilizing Monte Carlo simulations to precipitate the most advantageous possible outcome. As a result, the purchasing department was reorganized and newly staffed with individuals adroit in appropriate decision making techniques. Also as a result, the accounting department was reorganized and newly staffed by individuals with sufficient judgment to apply guidance, such as IAS 2.16.a | ASC 330-10-30-7, correctly.
Thus, if abnormal waste is caused by inadequate managerial decision making, it should be classified as an administrative expense allowing review at a higher administrative level.
Unfortunately, should not must, at least not under IFRS.
Specifically IAS 2.38 (edited, emphasis added) states: The amount of inventories recognised as an expense during the period, which is often referred to as cost of sales, consists of those costs previously included in the measurement of inventory ... and abnormal amounts of production costs of inventories...
Interpreted literally, this guidance indicates that including abnormal waste in cost of sales is appropriate. However, as discussed here, doing so may cause abnormal waste to be mistaken for normal, preventable waste, thereby hindering the corrective actions also discussed here.
Fortunately, if abnormal waste is material, auditors will require it to be flagged and, in all likelihood, excluded from cost of sales. Nevertheless, auditors would not be able to issue a qualified opinion solely because this exclusion was not made. Obviously, immaterial abnormal waste would not need to be flagged at all, and could be reported in cost of sales without explicitly violating any guidance.
In contrast, ASC 330 does not address cost of sales but focuses solely on inventory, requiring abnormal waste to be excluded. ASC 705 discusses cost of sales but simply refers to ASC 330. This implies that only those items explicitly includable in inventory may be included in cost of sales, and thus including abnormal waste in cost of sales would be an error and grounds for a qualified opinion.
Obviously, the above applies to, for example, an accounting manager at a subsidiary of a larger entity. In contrast, a chief accountant or chief accounting officer's task is to, in consultation with the company's independent external audit, establish adequate internal controls to make certain the guidance is applied correctly.
This is especially important at an entity applying US GAAP as, in addition to ASC guidance and SEC regulations, such entities, and the responsible member of management, are also subject to legal requirements, particularly those imposed by Sarbanes-Oxley, section 404.
Another issue. Assume the company buys 100 tonnes of fruit and vegetables. Will it sell 100 tonnes? No. Why? If the company offers the goods in a standard retail environment, allowing its customers to self-serve, a portion of the produce, commonly around 10%, will remain unsold no matter what the company does. Is it possible to prevent customers from mishandling this fragile merchandise? Is it possible to prevent them from selecting only the most attractive merchandise? Yes, it is. But this would require a specially trained employee to handle the merchandise and dispense it to customers.
Is an over-the-counter model the best model for selling fresh produce? Probably not.
However, as the wastage is not related to the acquisition of the produce, but rather its sale, it would need to be classified as selling or distribution, not inventory or cost of sales.
The same logic applies in other retail settings. While there are techniques to minimize shoplifting, preventing shoplifting requires over-the-counter sales.
While consumers accept this retail model for, for example, jewelry, watches, or sneakers (they may even accept the model where the displayed goods are not even freely sold but reserved for only "special" customers—perfected by brands such as Rolex and Ferrari), they will balk when it comes to most retail goods.
The point is, as there is no explicit criterion for distinguishing normal and abnormal wastage, judgment must be applied. As there is no guidance on how the wastage must be reported, judgment must be applied.
This also implies that auditors frequently test whether the normal/abnormal distinction is supportable, particularly internal auditors (external auditors will also test, but either at random or if the amounts are material).
While subsumed by the overall guidance on normal capacity (IAS 2.13 | ASC 330-10-30-6), low production or idle plant | abnormally low production or idle plant, popularly known as underutilized production capacity, is sufficiently important to warrant a separate, stand-alone discussion.
For example, assume a manufacturer planned to manufacture 10,000 units of a product annually and thus acquired a production line with an annual capacity of 10,000 units. For simplicity, also assume the plant cost 1,000,000 and had a life of 10 years. Each time a unit was produced, depreciation of 10 would be allocated to that unit.
However, assume that once production started, annual demand was for only 5,000 units. As a result, the manufacturer could not simply allocate 20 to each unit, as this would not be consistent with IAS 2.13 | ASC 330-10-30-6. Instead, 10 would be capitalized to inventory and the remaining 10 recognized as an administrative expense.
As with abnormal waste discussed above, costs associated with underutilized production capacity should be classified as administrative expenses. Rather than repeating the reasoning here, readers are encouraged to revisit the previous section, which is more common and controversial.
This accounting treatment is, however, predicated on the depreciation period being determined using a technological or commercial obsolescence criterion.
A discussion on the criteria used to determine useful life and depreciation period is provided on this page.
If the depreciation period is determined using a physical wear and tear criterion, the manufacturer could adjust the depreciation period to reflect that the plant was used at half capacity, which would logically extend its useful life by a like percentage.
Note: IAS 16.51 requires an annual review of the useful life of assets. IAS 16.55 prohibits the cessation of depreciation unless a units-of-production depreciation method is used. Unfortunately, auditors occasionally combine this guidance to mean that unless a units-of-production depreciation method is used, an asset's depreciation period may only be adjusted once per year, in the context of an annual review. This is an overly ambitious interpretation of the actual guidance and simply reflects an option that is not actually supported by the letter of the guidance.
Also note: as US GAAP has no requirement comparable to IAS 16.51 and 16.55 annual review, this issue has never come up in a US GAAP context.
- Administrative and general expenses
- Selling (distribution) expenses
- Double freight
- Rehandling
- Abnormal waste
- Idle or underutilized or production capacity
Additional Illsues:
- FIFO
As the name implies, first-in first-out tracks cost flows by assuming the oldest item is removed first. Picture a silo where fresh grain is placed on top and grain to be processed into flour is taken from the bottom.
Note: Of all the inventory tracking methods, FIFO is the simplest to apply, making it the most popular method among entities that keep their accounts in Excel. Conversely, although they may use this method, most entities applying IFRS | US GAAP use automated systems that are capable of calculating the preferred method, weighted average, automatically.
- Weighted average
As the name implies, the weighted average method tracks cost flows at their weighted average.
Note: while IAS 2.25 specifies that the avarage must be weighted, ASC 330-10-35-1B simply discusses an average. Neverthless, as using a simple average would not yeild an accurate result, a weighted average suld be used under both IFRS and US GAAP.
- LIFO
As the name implies, last-in first-out tracks cost flows by assuming the newest item is removed first. Picture a box of rocks where rocks are both added and taken from the top.
As this method can be used to create hidden reserves, LIFO is not allowed under IFRS.
As LIFO is allowed for US tax purposes only if used in financial reports, it is allowed under US GAAP.
Currently, Japan is the only other jurisdiction that allows LIFO. That said, since LIFO is not allowed under IFRS and almost no Japanese companies use US GAAP, this point is included here for completeness rather than practical importance.
Note: unlike the US, most jurisdictions disallow LIFO for taxation purposes thus dual national GAAP : IFRS filers do not need to make any adjustments. However, a dual US GAAP : IFRS filer would need to make adjustments if it elected to use LIFO for US GAAP purposes.
Also note: the tax advantage of LIFO is predicated on an inlationary envornment. As prices have been, except for a blip or three, stable for the past 40 years, it has gradually gone out of favor.
As noted above, the asset/liability model prevents the guidance from simply stating: when calculating cost of sales do not forget to adjust fixed costs so they can be treated as if variable. That would be too easy.
Instead the guidance says "... the allocation of fixed production overheads to the costs of conversion is based on the normal capacity of the production facilities. Normal capacity refers to a range of production levels. Normal capacity is the production expected to be achieved over a number of periods or seasons under normal circumstances..."
Unfortunately, ASC 330-10-30-3 does not specify how the "range of production levels" should be calculated. Fortunately, after reading IAS 2.13 "Normal capacity is the production expected to be achieved on average over a number of periods or seasons under normal circumstances..." it is clear that it would be an average.
So what the guidance is saying, pretend as it actual capacity is fixed by calculating its average. The allocate fixed costs to that fixed average. This is done on the asset side of the coin.
On the expense side of the coin one pretends fixed costs are variable and allocates this variable cost to cost of sales made variable by variable production.
As a coin is the same regardless of which side it happens to by lying on, both approaches lead to exactly the same result. The difference, the math for one is a walk in the park while for the other it involves some strenuous calisthenics.
Inventory is tested for recoverability by comparing its cost and net realizable value.
While IAS 2 does not provide any specific guidance on the issue, ASC 330-10-35-14 outlines a clear preference of a one per fiscal year test. Specifically, according to the letter of this guidance, a reduction to NRV recognized at the close of a fiscal year is irreversible. This implies that while entities can test more frequently than annually, this has no consequence as fat as the financial report is concerned, because any write-down made that is not made at the end of fiscal year is reversable.
Note: ASC 270-10-45-6 does provide additional guidance for interim periods, but does not change the core guidance provided by ASC 330-10-35-14.
Technically, recoverability is only explicitly mentioned by IAS 2.28, which states (edited): The cost of inventories may not be recoverable if those inventories are damaged, if they have become wholly or partially obsolete, or if their selling prices have declined...
Nevertheless, ASC 330-10-35-1B (edited) states: ...When evidence exists that the net realizable value of inventory is lower than its cost, the difference shall be recognized as a loss in earnings in the period in which it occurs...
Since checking to see if net realizable value is lower than cost is what testing for recoverability means, the guidance is comparable.
Both IFRS and US GAAP compare the original cost of the inventory with its net realizable value. Both define NRV as the expected selling price in the ordinary course of business less the expected costs necessary to liquidate the inventory. If the inventory being tested is WIP, cost to complete is also deducted.
While similar, their guidance is not identical. Unlike IFRS which leaves the composition of estimated costs necessary to make the sale to judgment, US GAAP specifies they should include transportation.
More importantly, while US GAAP converged with IFRS by moving from its previous ceiling / floor approach to the simpler lower of cost and NRV, it did not do so across the board. That would have been too easy.
In line with its proclivity for eschewing clear, concise and easy to apply guidance whenever recondite, byzantine, and impenetrable guidance is possible, ASC 330-10-35-1B retains LCM for LIFO and retail method items. Also true to form, it goes into more detail.
ASC 330-10-35-1C: A departure from the cost basis of pricing inventory measured using LIFO or the retail inventory method is required when the utility of the goods is no longer as great as their cost. Where there is evidence that the utility of goods, in their disposal in the ordinary course of business, will be less than cost, whether due to damage, physical deterioration, obsolescence, changes in price levels, or other causes, the difference shall be recognized as a loss of the current period. This is generally accomplished by stating such goods at a lower level commonly designated as market.
ASC 330-10-35-2: The cost basis of recording inventory ordinarily achieves the objective of a proper matching of costs and revenues. However, under certain circumstances cost may not be the amount properly chargeable against the revenues of future periods. A departure from cost is required in these circumstances because cost is satisfactory only if the utility of the goods has not diminished since their acquisition; a loss of utility shall be reflected as a charge against the revenues of the period in which it occurs. Thus, in accounting for inventories, a loss shall be recognized whenever the utility of goods is impaired by damage, deterioration, obsolescence, changes in price levels, or other causes. The measurement of such losses for inventory measured using LIFO or the retail inventory method shall be accomplished by applying the rule of pricing inventories at the lower of cost or market. This provides a practical means of measuring utility and thereby determining the amount of the loss to be recognized and accounted for in the current period.
ASC 330-10-35-3: The rule of lower of cost or market is intended to provide a means of measuring the residual usefulness of an inventory expenditure. The term market is therefore to be interpreted as indicating utility on the inventory date and may be thought of in terms of the equivalent expenditure which would have to be made in the ordinary course at that date to procure corresponding utility.
ASC 330-10-35-4: As a general guide, utility is indicated primarily by the current cost of replacement of the goods as they would be obtained by purchase or reproduction. In applying the rule, however, judgment must always be exercised and no loss shall be recognized unless the evidence indicates clearly that a loss has been sustained. There are therefore exceptions to such a standard. Replacement or reproduction prices would not be appropriate as a measure of utility when the estimated sales value, reduced by the costs of completion and disposal, is lower, in which case the realizable value so determined more appropriately measures utility.
ASC 330-10-35-5: Furthermore, when the evidence indicates that cost will be recovered with an approximately normal profit upon sale in the ordinary course of business, no loss shall be recognized even though replacement or reproduction costs are lower. This might be true, for example, in the case of production under firm sales contracts at fixed prices, or when a reasonable volume of future orders is assured at stable selling prices.
ASC 330-10-35-6: Paragraph superseded by Accounting Standards Update No. 2015-11.
ASC 330-10-35-7: Because of the many variations of circumstances encountered in inventory pricing, the definition of market is intended as a guide rather than a literal rule. It shall be applied realistically in light of the objectives expressed in this Subtopic and with due regard to the form, content, and composition of the inventory. For example, the retail inventory method, if adequate markdowns are currently taken, accomplishes the objectives described herein. It is also recognized that, if a business is expected to lose money for a sustained period, the inventory shall not be written down to offset a loss inherent in the subsequent operations.
If NRV ≥ cost, no action taken.
If NRV < cost, the inventory is written down to NRV.
However, such a straightforward summary does mask the challenges of applying the guidance in practice.
The first issue: the decline in value may be physical or financial.
For example, if a flood destroys merchandise in a warehouse, the decline is clearly physical. If a recession erodes customer buying power or expected deflation their incentive to spend, the decline is clearly financial.
However, in most cases, the physical and the financial are like the two sides of a coin.
In the absence of a clear dichotomy, the guidance covers both possibilities, and their blend.
IAS 2.28 states (edited): The cost of inventories may not be recoverable if those inventories are damaged, if they have become wholly or partially obsolete, or if their selling prices have declined.
ASC 330-10-35-1B (edited) states: [Loss recognition] may be required, for example, due to damage, physical deterioration, obsolescence, changes in price levels, or other causes.
Thus if the decline in NRV was caused by the merchandise falling, or being knocked, off a shelf, the decline in value would be just as real as if it were caused by a new model that causes the sales price of older models to fall.
Just as real but not (below) necessarily accounted for in the same way.
The second, arguably more important issue, the cause of the decline.
Unfortunately, while this issue does have the power to significantly affect how a decline in value is recognized and reported (or disclosed), the guidance is not clear-cut as it could be, particularly US GAAP guidance.
For example, the inventory item in question: notebook PCs. The notebooks in stock were acquired before the newer model, with a newer generation processor, was introduced.
If the loss had been caused by a simple break-in or fire, the accounting would have been effortless. It was not.
It was caused by something preventable. True, technological obsolescence cannot be avoided or, as the Luddites learned the hard way, prevented. But managerial decisions can be made to ensure obsolescence does not drag down earnings.
Specifically, notebooks were ordered by a purchasing manager who, while experienced, had previously worked in the white goods. Not realizing the obsolescence curves of refrigerators and notebook PCs were uncorrelated, the manager placed an excessive order.
Oops.
The problem is, ASC 330-10-35-1B, the same paragraph that also discusses obsolescence, states (edited, emphasis added): ...When evidence exists that the net realizable value of inventory is lower than its cost, the difference shall be recognized as a loss in earnings in the period in which it occurs...
However, would it be acceptable accounting policy to recognize and report a clearly reasonably preventable decline in value in a way that would make it indistinguishable from a loss caused by a fire or flood or perhaps even a change in currency exchange rates?
Clearly not.
Thus, ASC 330-10-35-1B may not be applied on a stand-alone basis but must be applied together with ASC 330-10-30-7 (above) to arrive at policy that not only pedantically reflects the letter of a single paragraph, but is consistent with the topic as a whole.
Fortunately, this is mostly a US GAAP-specific complication.
IAS 2.34 (edited) states: ... The amount of any write-down of inventories to net realisable value and all losses of inventories shall be recognised as an expense in the period the write-down or loss occurs...
While not as crystal clear as it could be, the guidance does distinguish between "write-down of inventories to net realisable value" and "losses of inventories," suggesting that an evaluation of the nature of the decline in value, and particularly whether the decline was preventable or reasonable preventable (not the same thing), should be performed and used to determine how the decline in value is reported on the profit and loss statement and/or disclosed in the footnotes.
Be that as it may, as a rule of thumb, if the decline in value was not preventable, it would be recognized and reported as a loss. If the decline was preventable, it would be examined carefully as illustrated below. If the decline was reasonably preventable, it would be an expense. Which expense? That is discussed above.
The term full absorption costing is not specifically mentioned in IAS 2 or ASC 330. Nevertheless, it is commonly used to describe the procedure those standards require.
In short, the process starts by recognizing acquired material as raw material. When production begins, raw material (or a portion) is first derecognized then recognized in WIP. As production continues, additional costs are added to WIP. These include direct wages, and both fixed and variable indirect production costs.
Once production is complete, the costs accumulated in WIP are derecognized and recognized as finished goods. Finally, when the product is sold, the finished goods are derecognized and cost of goods sold recognized.
The accounting for services is economically identical. Costs of services incurred before services are begun, or during their rendering but before revenue is recognized, are capitalized. They remain as assets until control over the services passes to the customer and revenue recognized. At this point, the previously capitalized costs are derecognized and recognized as cost of services rendered (or simply cost of sales). However, regardless of what the above discussion implies, the accounting for services is sufficiently different to be illustrated on a separate page page.
Note: an added benefit of illustrating services separately is that it satisfies the pedantic proclivities of those who claim that, just because the guidance is called Inventory, it applies only to inventory.
Inventory and cost of sales (above) are two sides of the same coin, so discussing one without the other is like trying to buy candy with a one sided coin.
Kidding aside, a related but also important issue: the nature or expense / function of dichotomy.
Particularly its practical implications.
A general ledger built on a nature of expense premise is an order of magnitude easier to apply. As this issue involves delving into account structure, it is covered in more detail in this section dedicated to the COA.
This section merely emphasizes that the recent update to US GAAP makes including a nature of expense account block not just good sense, but necessary as from 12/16/2026 ASU 2024-03 added ASC 220-40-50-6, which requires entities to disclose nature of expense expenses. This in turn requires them to keep track of these expenses.
Users who have downloaded any of our charts of accounts over the years are already covered. Users that have not, are encouraged to do so now.
Note: unlike IAS 1, which not only allows but considers nature of expense format as primary (and IFRS 18, which attempts to blend the two), ASC 220-40-50-6 only outlines disclosure requirements. Thus, entities will continue to publish function of expense income statements. Nature of expense income statements will remain disallowed under US GAAP.
- Cost flows
- Normal capacity
- Lower of cost or market
- Full absorption costing
- Function / nature of expense
Illustrations
Merchandise
Perpetual method
1/2/X1, XYZ sold 2 units of merchandise 123 for 20 each in cash.
Dr/Cr
|
1/2/X1 | 2.1.X1 |
|
|
|
|
Cash |
40 |
|
|
|
|
Revenue: Merchandise |
|
40 |
|
Cost of merchandise sold |
20 |
|
|
|
|
Inventory: Merchandise: 123 |
|
20 |
XYZ had previously acquired merchandise 123 at a weighted average cost of 10 per unit.
Note: in addition to weighted average, IAS 2.25 allows the first-in first-out (FIFO) method but does not allow a last-in first-out (LIFO) method. In contrast, ASC 330-10-30-11 allows all three methods.
Same facts except, while physically identical, the products each had an ISO/IEC 18004-compliant code, had been acquired in two lots and so had a per item cost of 10.20 and 10.12 respectively. XYZ elected to use a specific identification method although it is not consistent with the the letter of guidance.
IAS 2.24 (edited, emphasis added) states: ... However, specific identification of costs is inappropriate when there are large numbers of items of inventory that are ordinarily interchangeable. In such circumstances, the method of selecting those items that remain in inventories could be used to obtain predetermined effects on profit or loss.
While not as categorical, ASC 330-10-30-11 (edited, emphasis added) states: accordingly, if the materials purchased in various lots are identical and interchangeable, the use of identified cost of the various lots may not produce the most useful financial statements...
However, XYZ considered that IAS 2 | ASC 330 dates from middle of the 20th century and has not had any, major updates. Consequently, it reflects a simpler time, when tracking individual costs accurately was not feasible and could be subject to manipulation.
This may have been an issue when information technology was in its infancy. In contrast, modern IT systems can track and record costs at a granular level and include built-in audit trail features that make verifying accuracy practically effortless.
While any information system can be overridden or misused to intentionally distort accounting, this is primarily an internal control issue, not an accounting policy matter. Moreover, modern software incorporates robust checks and balances that, while not infallible, make such manipulation significantly more difficult than with the systems in place when IAS 2 and ASC 330 were originally drafted.
XYZ also considered that the guidance focuses on accounting methodology (a rules based approach) while the IFRS | US GAAP conceptual framework has shifted focus to more heavily emphasizes principles, as shown in modern standards such as IFRS 15 and 16 | ASC 660 and 482 which were wholesale replacements for older, more rules based guidance, which was very similar in style to IAS 2 | ASC 330.
Following modern trends to their logical conclusion, XYZ also considered that any method that more faithfully represented an entity's financial position and changes therein, is superior to any method that fails to do so, even if the latter comprises explicit guidance (as previously noted) is inconsistent with modern trends and so can be considered well past its best before date.
On the basis of these considerations, XYZ concluded that specific identification is the only logical method.
Its auditor enthusiastically concurred.
Some auditors gladly embrace new interpretations of outdated guidance; some have the knee jerk reflex to disagree with anything but a pedantic interpretation of any guidance.
For example, an auditore may express their reservations as follows:
Basis for Qualification
We draw attention to the accounting policy adopted by XYZ for inventory valuation, specifically the use of the specific identification method to assign costs to inventory items that are functionally interchangeable and purchased in multiple lots with minor cost differences.
According to IAS 2.24 | ASC 330-10-30-11, the specific identification method is considered inappropriate when applied to large quantities of interchangeable items, as it may not provide the most reliable and neutral measurement of inventory cost and cost of goods sold. These standards recommend cost flow assumptions such as FIFO or weighted average in such circumstances to ensure faithful representation and comparability.
XYZ has elected to depart from this guidance, asserting that the specific identification method better reflects the economic reality due to the unique traceability of individual units via ISO/IEC 18004-compliant codes.
While we acknowledge the enhanced traceability, the functional interchangeability of the items and the minimal cost differentials raise concerns that the use of specific identification may allow selective cost assignment, potentially affecting the neutrality and comparability of financial statements.
Impact on Financial Statements
The departure from the prescribed inventory costing methods could result in variations in reported profit margins and inventory valuations that differ from those produced by FIFO or weighted average methods. This may affect the comparability of XYZ's financial statements with those of other entities and prior periods.
Auditor's Conclusion
In our opinion, the departure from the guidance on inventory costing described is not consistent with IFRS | US GAAP guidance and would necessitate qualified opinion unless corrected.
But, as financial reporting is the responsibility of management, it may challenge any conclusion.
While the items are functionally interchangeable, each item is economically unique due to its traceability via ISO/IEC 18004-compliant codes. Recognizing the individual costs of each item would thus be mathematically identical to a weighted average method unless the weighted average method were not calculated rigorously. The weighted average method is required by IAS 2.24 | allowed by ASC 330-10-30-11.
While the items are physically fungible, they are economically separable and unique due to their QR traceability. Insisting on applying the separability criterion on the basis of physical attributes contradicts the fundamental logic of financial reporting standards, which prioritize faithful representation of economic substance over mere physical characteristics.
XYZ's choice reflects sound professional judgment aimed at achieving faithful representation, leveraging modern traceability technology to align cost recognition with actual inventory flow. This judgment is consistent with the conceptual framework underpinning IFRS and US GAAP even if it is not fully consistent with standards that have not been significantly updated from a time where such tracking technology did not exist.
Given that a weighted average method, if calculated rigorously, would yield a result identical to specific identification, concerns about selective cost assignment are theoretical and unsupported since any divergence is predicated on the assumption that an intent to manipulate exists. This is not, however an accounting but an internal control issue. As the internal controls implemented by XYZ are both adequate and have been tested by the auditor, these concerns are ungrounded.
The claim that "The departure from the prescribed inventory costing methods could result in variations in reported profit margins and inventory valuations that differ from those produced by FIFO or weighted average methods" is, as noted above, not supported by fact.
Thus, in the professional option of the chief accounting officer, the auditor's justification for its qualification is not supportable which we will duly note in the footnote description of our chosen accounting policies.
Thus, the real question: is the juice worth the squeeze ?
If the entity has invested in a robust accounting system to track and specifically allocate costs accurately and using a separate, parallel system just to overcome unfounded auditor objects involves a cost, then yes, it is.
On the other hand, if it is software feature that can simply be turned on, it would be pointless to argue the point.
After all, accountants and auditors can have real differences of opinion; focusing on the important ones makes everyone's life easier.
|
1/2/X1 | 2.1.X1 |
|
|
|
|
Cash |
40.00 |
|
|
|
|
Revenue: Merchandise |
|
40.00 |
|
Cost of merchandise sold |
20.32 |
|
|
|
|
Inventory: Merchandise: 123456 |
|
10.20 |
|
|
Inventory: Merchandise: 456789 |
|
10.12 |
Periodic method
1/1/X1, XYZ had 250 units of merchandise #123 (acquired in X0 for 10 each) in stock. 1/5/X1, it acquired 500 units of merchandise #234 for 25 each. 1/15/X1, it acquired 700 units of merchandise #123 for 10 each. 1/30/X1, it acquired 1,000 units of merchandise #456 for 30 each.
Dr/Cr
|
1/5/X1 | 5.1.X1 |
|
|
|
|
Inventory: Purchases: Merchandise: 234 |
12,500 |
|
|
|
|
Accounts payable |
|
12,500 |
Purchases is a temporary account that must be closed at the end of each period.
Permanent (balance sheet) accounts are not closed at the end of the period and so their balance is taken to the balance sheet. In contrast, temporary accounts are closed at the end of each period and no balance to be taken to the balance sheet remains.
Since IFRS | US GAAP does not provide any guidance on the accounts to be used in the bookkeeping process, companies are free to set up any number of temporary accounts.
Its purpose is to match revenue and expenses.
IAS 2.34 states: When inventories are sold, the carrying amount of those inventories shall be recognised as an expense in the period in which the related revenue is recognised...
While less explicit, ASC 330-10-10-1 states: A major objective of accounting for inventories is the proper determination of income through the process of matching appropriate costs against revenues.
Since this guidance does not allow inventory to be expensed as acquired, when a periodic inventory method is used, a temporary Purchases account needs to be set up.
|
1/15/X1 | 15.1.X1 |
|
|
|
|
Inventory: Purchases: Merchandise: 123 |
7,000 |
|
|
|
|
Accounts payable |
|
7,000 |
|
1/30/X1 | 30.1.X1 |
|
|
|
|
Inventory: Purchases: Merchandise: 456 |
30,000 |
|
|
|
|
Accounts payable |
|
30,000 |
1/2/X1, it sold 2 units of #123 for 20. 1/7/X1, it sold one unit of #234 for 50 and three of #123 for 20.
|
1/2/X1 | 2.1.X1 |
|
|
|
|
Cash |
40 |
|
|
|
|
Revenue: Merchandise |
|
40 |
|
1/7/X1 | 7.1.X1 |
|
|
|
|
Cash |
110 |
|
|
|
|
Revenue: Merchandise |
|
110 |
During January, records showed that 800 units of #123, 300 of #234 and zero of #456 had been sold.
|
# |
Units acquired |
Units sold |
Unit price |
Purchases |
Sales |
Inventory |
|
|
A |
B |
C |
D = A x C |
E = B x C |
F = B + E |
|
123 |
700 |
(800) |
10 |
7,000 |
(8,000) |
(1,000) |
|
234 |
500 |
(300) |
20 |
12,500 |
(7,500) |
5,000 |
|
456 |
1,000 |
0 |
30 |
30,000 |
0 |
30,000 |
|
|
|
|
|
|
(15,500) |
34,000 |
|
|
|
|
|
|
|
|
|
1/31/X1 | 31.1.X1 |
|
|
|
|
Cost of merchandise sold |
15,500 |
|
|
|
Inventory: Merchandise: 234 |
5,000 |
|
|
|
Inventory: Merchandise: 456 |
30,000 |
|
|
|
|
Inventory: Purchases: Merchandise: 123 |
|
7,000 |
|
|
Inventory: Purchases: Merchandise: 234 |
|
12,500 |
|
|
Inventory: Purchases: Merchandise: 456 |
|
30,000 |
|
|
Inventory: Merchandise: 123 |
|
1,000 |
XYZ's policy is to make these adjustments at the end of each month.
A different periodicity, for example each quarter, would also be acceptable.
Same facts except, XYZ recognized purchases directly to cost of sales.
|
1/2/X1 | 2.1.X1 |
|
|
|
|
Cash |
40 |
|
|
|
|
Revenue: Merchandise |
|
40 |
|
1/5/X1 | 5.1.X1 |
|
|
|
|
Cost of merchandise sold |
12,500 |
|
|
|
|
Accounts payable |
|
12,500 |
|
1/7/X1 | 7.1.X1 |
|
|
|
|
Cash |
110 |
|
|
|
|
Revenue: Merchandise |
|
110 |
|
1/15/X1 | 15.1.X1 |
|
|
|
|
Cost of merchandise sold |
7,000 |
|
|
|
|
Accounts payable |
|
7,000 |
|
1/30/X1 | 30.1.X1 |
|
|
|
|
Cost of merchandise sold |
30,000 |
|
|
|
|
Accounts payable |
|
30,000 |
At the end of the period, it adjusted cost of sales (caveat).
|
# |
Beginning |
Purchases |
Ending |
Cost of Sales |
Change |
|
|
A |
B |
C |
D = A + B + C |
E = B - D |
|
123 |
2,500 |
7,000 |
(1,500) |
8,000 |
(1,000) |
|
234 |
0 |
12,500 |
(5,000) |
7,500 |
5,000 |
|
456 |
0 |
30,000 |
(30,000) |
0 |
30,000 |
|
|
2,500 |
49,500 |
(36,500) |
15,500 |
34,000 |
|
|
|
|
|
|
|
The procedure outlined in this illustration is not consistent with the letter of the guidance.
IAS 2.10 states: The cost of inventories shall comprise all costs of purchase, costs of conversion and other costs incurred in bringing the inventories to their present location and condition.
As the word shall is a command, the guidance, if read carefully, explicitly states that the only acceptable procedure for recognizing the acquisition of inventory is to debit inventory and credit a cost.
Similarly, ASC 330-10-30-1 states: The primary basis of accounting for inventories is cost, which has been defined generally as the price paid or consideration given to acquire an asset. As applied to inventories, cost means in principle the sum of the applicable expenditures and charges directly or indirectly incurred in bringing an article to its existing condition and location. It is understood to mean acquisition and production cost, and its determination involves many considerations.
While the guidance is framed differently, it is just as categorical: the only acceptable procedure for recognizing the acquisition of inventory is to debit inventory and credit a cost.
Debiting cost of sales and crediting a cost, as shown in this illustration, is thus not consistent with a literal interpretation of the guidance.
Nevertheless, provided the amount recognized to cost of sales during the period is accurately determined, derecognized from cost of sales and recognized to inventory, the result would be acceptable.
IAS 2 and ASC 330 are old standards issued when accounting guidance was more rules-focused, prescribing specific methods rather than outlining principles. Today, the conceptual framework and accounting standards have evolved to be less focused on prescribing explicit accounting procedures. Therefore, it is appropriate and often necessary to interpret older, rules-based guidance through a modern, principles-based prism.
Fortunately, with the topic at hand, initially expensing costs and subsequently reversing cost of sales is fairly common (as well as implicit in the nature of expense classification scheme) and rarely challenged by auditors. This generally makes it unnecessary to justify this policy decision as thoroughly as the application of specific costing, which needed to be justified in the previous illustration.
|
1/31/X1 | 31.1.X1 |
|
|
|
|
Inventory: Merchandise: 234 |
5,000 |
|
|
|
Inventory: Merchandise: 456 |
30,000 |
|
|
|
|
Cost of merchandise sold |
|
34,000 |
|
|
Inventory: Merchandise: 123 |
|
1,000 |
Retail method
XYZ is a retailer. 12/31/X0, its merchandise inventory stood at 240,000. During X1, it made purchases of 3,000,000 and sales of 4,500,000. 12/31/X1, its merchandise on hand, measured at retail price, was 480,000. To determine inventory cost, it applied retail method using its standard retail mark-up of 50%.
The retail method is allowed by IAS 2.21 | ASC 330-10-30-13. It is a shortcut for retailers who, rather than keeping track of the original cost of inventory items, only keep track of their sales price from which they deduct their margin to arrive at reported inventory.
While still in moderate use, the availability and relative low cost of automated inventory tracking tools has seen its prevalence steadily decline.
This site does not recommend its use but, as it is still an allowed alternative, it presents a basic illustration.
Dr/Cr
|
1/1/X1 - 31.12.X1 | 1.1.X1 - 31.12.X1 |
|
|
|
|
Cash, Bank cards, etc. |
4,300,000 |
|
|
|
|
Cash, Payables |
|
4,300,000 |
|
Inventory: Merchandise: Purchases |
3,000,000 |
|
|
|
|
Cash, Payables |
|
3,000,000 |
|
12/31/X1 | 31.12.X1 |
|
|
|
|
Cost of merchandise sold |
2,920,000 |
|
|
|
Inventory: Merchandise |
320,000 |
|
|
|
|
Inventory: Merchandise: Purchases |
|
3,000,000 |
2,920,000 = 240,000 + 3,000,000 - 320,000
320,000 = 480,000 ÷ (1+50%)
In more detail:
XYZ's stock on hand at 12/31/X1:
|
Item # |
Units in stock |
Unit price |
Merchandise at retail |
Adjusted to cost |
|
|
A |
B |
C = A x B |
D = C ÷ (1 + 50%) |
|
Merch.1 |
538 |
80.35 |
43,230 |
28,820 |
|
Merch.2 |
269 |
285.70 |
76,854 |
51,236 |
|
Merch.3 |
65 |
665.00 |
43,225 |
28,816 |
|
Merch.4 |
262 |
329.66 |
86,370 |
57,580 |
|
Merch.5 |
91 |
529.08 |
48,146 |
32,097 |
|
Merch.6 |
97 |
738.88 |
71,672 |
47,781 |
|
Merch.7 |
168 |
285.70 |
47,998 |
31,999 |
|
Merch.8 |
184 |
339.71 |
62,506 |
41,671 |
|
|
|
|
480,000 |
320,000 |
|
12/31/X1 | 31.12.X1 |
|
|
|
|
Cost of merchandise sold |
2,920,000 |
|
|
|
Inventory: Merchandise: Merch. 1 |
28,820 |
|
|
|
Inventory: Merchandise: Merch. 2 |
51,236 |
|
|
|
Inventory: Merchandise: Merch. 3 |
28,816 |
|
|
|
Inventory: Merchandise: Merch. 4 |
57,580 |
|
|
|
Inventory: Merchandise: Merch. 5 |
32,097 |
|
|
|
Inventory: Merchandise: Merch. 6 |
47,781 |
|
|
|
Inventory: Merchandise: Merch. 7 |
31,999 |
|
|
|
Inventory: Merchandise: Merch. 8 |
41,671 |
|
|
|
|
Inventory: Merchandise Merch. 1 |
|
24,052 |
|
|
Inventory: Merchandise Merch. 2 |
|
12,425 |
|
|
Inventory: Merchandise Merch. 3 |
|
27,053 |
|
|
Inventory: Merchandise Merch. 4 |
|
57,287 |
|
|
Inventory: Merchandise Merch. 5 |
|
27,040 |
|
|
Inventory: Merchandise Merch. 6 |
|
29,303 |
|
|
Inventory: Merchandise Merch. 7 |
|
25,000 |
|
|
Inventory: Merchandise Merch. 8 |
|
37,840 |
|
|
Inventory: Merchandise: Purchases |
|
3,000,000 |
|
|
At 12/31/X0 |
|||
|
Item # |
Units |
Purch. Price |
Sales price |
Stock value |
|
|
A |
B |
C = A x B |
D=C÷(1+50%) |
|
Merch. 1 |
450 |
80.17 |
36,078 |
24,052 |
|
Merch. 2 |
68 |
274.07 |
18,637 |
12,425 |
|
Merch. 3 |
61 |
665.23 |
40,579 |
27,053 |
|
Merch. 4 |
259 |
331.78 |
85,931 |
57,287 |
|
Merch. 5 |
78 |
520.00 |
40,560 |
27,040 |
|
Merch. 6 |
59 |
745.00 |
43,955 |
29,303 |
|
Merch. 7 |
150 |
250.00 |
37,500 |
25,000 |
|
Merch. 8 |
172 |
330.00 |
56,760 |
37,840 |
|
|
|
|
360,000 |
240,000 |
For illustration purposes, only a single, annual adjustment is shown.
Production
Job costing
XYZ produces bespoke products that lend themselves to the specific identification of individual costs.
IAS 2.23 | ASC 330-10-30-10 establish the specific identification as the base method for non-serial manufacturing, commonly known as job costing. While the guidance discourages the use of specific identification in serial manufacturing advancements in automated costing system have made tracking individual items in mass production settings feasible.
That being said, if the specific identification method were used in a serial manufacturing context, it would be inconsistent with a literal interpretation of the guidance and may encounter auditor resistance. Fortunately, such resistance is not difficult to overcome.
IAS 2.23 states (emphasis added): The cost of inventories of items that are not ordinarily interchangeable and goods or services produced and segregated for specific projects shall be assigned by using specific identification of their individual costs.
IAS 2.25 (edited, emphasis added)) continues: The cost of inventories, other than those dealt with in paragraph 23, shall be assigned by using the first-in, first-out (FIFO) or weighted average cost formula. ...
While similar, ASC 330-10-30-11 is nowhere near as categorical, merely pointing out: the use of identified cost of the various lots may not produce the most useful financial statements.
While this would be unusual in jurisdictions with a history of applying principles-based standards, such as the United States or United Kingdom, in jurisdictions accustomed to applying statutory accounting laws, such as continental Europe and Latin America, auditors tend to adopt literal, pedantic interpretations of accounting law and often carry this tendency over when applying judgment-based accounting frameworks such as IFRS and US GAAP.
During the course of our audit, we identified that the entity applies the specific identification method to value inventory produced through serial manufacturing processes. We consider this accounting treatment to be materially inappropriate and not in conformity with the applicable financial reporting frameworks, specifically IAS 2 and ASC 330.
Basis for Qualification:
1. Non-Compliance with IAS 2 Requirements
IAS 2.23 clearly stipulates that the specific identification method is appropriate only for inventories that are not ordinarily interchangeable and are produced for specific projects or customers, typically within non-serial or job order manufacturing contexts. The standard explicitly discourages the use of specific identification in serial manufacturing environments, citing practical difficulties in reliably tracing individual costs for large volumes of homogeneous items. The entity’s use of specific identification in serial manufacturing is therefore inconsistent with IAS 2’s fundamental principles and guidance.
2. Contravention of ASC 330-10-30-10 Guidance
ASC 330-10-30-10 similarly restricts the use of specific identification to situations where individual inventory items can be distinctly identified and tracked. In serial manufacturing, where products are mass-produced and largely indistinguishable, the use of specific identification is impractical and undermines the reliability of inventory cost measurement. The entity’s application of this method in such a context contravenes ASC 330 requirements.
3. Material Misstatement Risk and Impact on Financial Statements
The adoption of specific identification in serial manufacturing introduces significant risk of material misstatement in inventory valuation. This method presupposes precise cost tracking for each unit, which is operationally challenging and often unfeasible in mass production settings. Consequently, the inventory balances and cost of goods sold reported may be misstated, impairing the fair presentation of the financial statements.
4. Lack of Alternative Cost Flow Methods
The entity has not demonstrated the application of alternative, more appropriate cost flow assumptions such as FIFO, weighted average, or standard costing, which are widely accepted for serial manufacturing inventories and endorsed by both IAS 2 and ASC 330. This omission further exacerbates the risk of material misstatement.
Conclusion and Impact on Audit Opinion:
In our judgment, the entity’s use of specific identification for serial manufacturing inventory constitutes a departure from the requirements of IAS 2 and ASC 330. This departure has a pervasive effect on the valuation of inventory and related cost of goods sold, which we consider material but not pervasive to the financial statements as a whole.
Accordingly, we intend to issue a qualified opinion on the financial statements due to the inappropriate application of the specific identification method in serial manufacturing inventory valuation.
We acknowledge the auditor’s concerns regarding our application of the specific identification method for inventory valuation in our serial manufacturing operations. However, we respectfully disagree with the assertion that this approach constitutes a departure from IAS 2 and ASC 330, and we provide the following clarifications and justifications:
1. Alignment with the Principles of IAS 2 and ASC 330
While IAS 2.23 and ASC 330-10-30-10 traditionally highlight specific identification as most appropriate for non-serial or job order manufacturing, neither standard explicitly prohibits its use in serial manufacturing. The guidance reflects historical practical challenges rather than an absolute restriction. Both standards emphasize the objective of faithfully representing inventory cost and ensuring reliable financial reporting.
2. Technological Advancements Enable Feasibility and Accuracy
Recent advances in manufacturing execution systems (MES), enterprise resource planning (ERP) software, and cost tracking technologies now enable precise identification and tracing of costs on a per-unit basis, even in mass production environments. Our robust costing system captures actual costs at each stage of production, ensuring that inventory valuation reflects the true cost of goods manufactured.
3. Enhanced Reliability and Reduced Estimation Uncertainty
The specific identification method, as implemented by our entity, provides the most accurate and reliable inventory valuation compared to alternative cost flow assumptions such as FIFO or weighted average, which rely on estimations and assumptions that may distort cost allocation in our complex manufacturing environment. This approach reduces the risk of material misstatement and enhances the transparency of our financial statements.
4. Consistent Application and Full Disclosure
Our application of specific identification in serial manufacturing is consistent, systematic, and fully disclosed in the notes to the financial statements, including the rationale and the technological capabilities supporting this approach. This transparency ensures that users of the financial statements are fully informed and can appropriately assess the inventory valuation methodology.
5. Professional Judgment and Interpretative Flexibility
Accounting standards require professional judgment in applying principles to evolving business practices and technologies. Our interpretation aligns with the overarching objective of IAS 2 and ASC 330—to provide relevant and reliable financial information. We believe our approach is consistent with these objectives and represents sound accounting practice.
Conclusion
Given the above, we maintain that the use of the specific identification method for serial manufacturing inventory is appropriate, compliant with applicable accounting standards, and results in a fair presentation of our financial position and performance. We respectfully request the auditor to reconsider their position and withdraw the proposed qualification.
We also remind the auditor that, as management, we are responsible for our financial reporting. Accordingly, we will include our rebuttal and a full description of our inventory valuation method in the footnotes to the financial statements. As this method leads to objectively and demonstrably superior results and provides a more faithful representation of our financial position and its changes, we do not intend to change our approach, especially considering that any potential difference would not materially affect the financial statements.
On 4/1/X1, supervisor #23 received job order #4-0001 and entered it into the production queue under product number YYX1-04-0001. He then assigned employee #65, whose first task was to requisition two units of Material #4 and one unit of Material #8. During the day, employees #65, #53, and #72 performed the first three production tasks, utilizing production machines #25, #36, and #48. These tasks required 70, 80, and 45 minutes respectively, with the workers’ hourly compensation rates being 25.00, 22.50, and 23.00.
Dr / Cr
|
4/1/X1 | 1.4.X1 |
|
|
|
|
Inventory: WIP YYX1-04-0001: Direct Material |
61.80 |
|
|
|
|
Inventory: Raw material: #4: Lot 1 |
|
16.15 |
|
|
Inventory: Raw material: #4: Lot 2 |
|
18.65 |
|
|
Inventory: Raw material: #8: Lot 1 |
|
27.00 |
|
Inventory: WIP YYX1-04-0001: Direct Wages |
76.42 |
|
|
|
Accrued Liabilities: Wages and Salaries: Production Wages: 53 |
|
30.00 |
|
|
|
Accrued Liabilities: Wages and Salaries: Production Wages: 65 |
|
29.17 |
|
|
Accrued Liabilities: Wages and Salaries: Production Wages: 72 |
|
17.25 |
1/1/X1, XYZ had 500 units of material #4 and no material #8 in stock. Material #4 had been purchased for 16.15 in the previous period. 1/15/X1, XYZ acquired an additional 2,500 units of this material at 18.65 per unit also 5,000 units of material #8 at 27.00 per unit.
|
1/15/X1 | 1.15.X1 |
|
|
|
|
Inventory: Raw material: #4: Lot 2 |
46,625 |
|
|
|
Inventory: Raw material: #8 |
135,000 |
|
|
|
|
Cash or Payables |
|
181,625 |
Note: applying IAS 2.23 | ASC 330-10-30-10, requires tracking material cost by lot number (where applicable).
While IFRS | US GAAP considers the specific identification method to be acceptable, IFRS expresses a preference for this approach | US GAAP does not.
IAS 2.23 The cost of inventories of items that are not ordinarily interchangeable and goods or services produced and segregated for specific projects shall be assigned by using specific identification of their individual costs.
IAS 2.24: Specific identification of cost means that specific costs are attributed to identified items of inventory. This is the appropriate treatment for items that are segregated for a specific project, regardless of whether they have been bought or produced. However, specific identification of costs is inappropriate when there are large numbers of items of inventory that are ordinarily interchangeable. In such circumstances, the method of selecting those items that remain in inventories could be used to obtain predetermined effects on profit or loss.
ASC 330-10-30-10: The cost to be matched against revenue from a sale may not be the identified cost of the specific item which is sold, especially in cases in which similar goods are purchased at different times and at different prices. While in some lines of business specific lots are clearly identified from the time of purchase through the time of sale and are costed on this basis, ordinarily the identity of goods is lost between the time of acquisition and the time of sale.
ASC 330-10-30-11: Accordingly, if the materials purchased in various lots are identical and interchangeable, the use of identified cost of the various lots may not produce the most useful financial statements. This fact has resulted in the general acceptance of several assumptions with respect to the flow of cost factors such as FIFO, average, and LIFO to provide practical bases for the measurement of periodic income.
5/2/X1, XYZ paid April wages which were 2,336,900.54 in total.
|
5/2/X1 | 2.5.X1 |
|
|
|
|
Accrued Liabilities: Wages and Salaries: Production Wages |
2,336,900.54 |
|
|
|
|
Cash |
|
2,336,900.54 |
Variable production overhead
|
4/1/X1 | 1.4.X1 |
|
|
|
|
Inventory: WIP YYX1-04-0001: Supervisor salaries |
12.73 |
|
|
|
|
Accrued Liabilities: Wages and Salaries: Production Salaries: 23 |
|
2.23 |
|
|
Accrued Liabilities: Wages and Salaries: Production Salaries: 24 |
|
10.50 |
|
Inventory: WIP YYX1-04-0001: Maintenance and Repairs |
5.38 |
|
|
|
|
PP&E: Production Machinery: MRO Allowance: Machine 25 |
|
1.28 |
|
|
PP&E: Production Machinery: MRO Allowance: Machine 36 |
|
1.54 |
|
|
PP&E: Production Machinery: MRO Allowance: Machine 48 |
|
2.56 |
|
Inventory: WIP YYX1-04-0001: Utilities |
7.17 |
|
|
|
|
Accrued Liabilities: Utilities: Electricity |
|
2.56 |
|
|
Accrued Liabilities: Utilities: Gas |
|
2.05 |
|
|
Inventory: Unallocated Production Overhead: Utilities: Water and Sewage |
|
1.54 |
|
|
Inventory: Unallocated Production Overhead: Utilities: Waste Removal |
|
1.02 |
|
Inventory: WIP YYX1-04-0001: Indirect Material |
4.33 |
|
|
|
|
Inventory: Supplies & Consumables: Production Supplies |
|
1.85 |
|
|
Inventory: Supplies & Consumables: Consumables |
|
2.47 |
ASC 360-10-25-5 prohibits the use of the accrue-in-advance (accrual) method for planned major maintenance activities. This guidance has been interpreted to mean that an allowance for MRO cannot be recognized. However, as the guidance addresses liabilities, not allowances, this interpretation is not correct.
The guidance was originally introduced by FSP AUG AIR-1.5, which aimed to disallow the recognition of liabilities and has since been superseded anyway.
Specifically, in explaining FSP AUG AIR-1.3, the FASB (edited, emphasis added) stated: The Board believes that the accrue-in-advance method of accounting for planned major maintenance activities results in the recognition of liabilities that do not meet the definition of a liability in FASB Concepts Statement...
Since an allowance is a contra asset rather than a liability, it can be recognized without conflicting with either the letter or the spirit of the guidance.
Similarly, IAS 37 prohibits recognizing provisions for repairs and maintenance. It does not prohibit allowances. The clearest guidance is provided by IAS 37.Example 11 Repairs and maintenance.
Payments and pre-payments
4/3/X1, XYZ paid first quarter electricity 425,448.66 and natural gas 288,486.71. It also pre-paid second quarter water and sewage 100,000.00 and waste removal 200,000.00.
While electricity and gas are invoiced and paid in arrears each quarter, water, sewage and waste removal are paid in advance and invoiced annually. Rent is not invoiced at all, but paid in advance on the basis of an ongoing rental agreement.
|
4/3/X1 | 3.4.X1 |
|
|
|
|
Accrued Liabilities: Utilities: Electricity |
425,448.66 |
|
|
|
Accrued Liabilities: Utilities: Gas |
288,486.71 |
|
|
|
Inventory: WIP Unallocated Overhead: Utilities: Water and Sewage |
200,000.00 |
|
|
|
Inventory: WIP Unallocated Overhead: Utilities: Waste Removal |
400,000.00 |
|
|
|
|
Cash |
|
1,313,935.37 |
|
|
Alternatively |
|
|
|
Inventory: WIP Pre-Paid Costs: Utilities: Water and Sewage |
200,000 |
|
|
|
Inventory: WIP Pre-Paid Costs: Utilities: Waste Removal |
400,000 |
|
|
|
Inventory: WIP Pre-Paid Costs: Rent |
800,000 |
|
|
In X0, the cost of fasteners and fittings, and consumables averaged 3% and 4% of total direct material cost. As these amounts are not material, XYZ simply estimates indirect material usage on the basis of direct material usage and adjusts any deviations at the end of the annual period.
During the first quarter, XYZ purchased fasteners and fittings for 23,129.15, and consumables for 27,326.98.
|
1/1/X1 to 31/3/X1 | 1.1.X1 to 31.4.X1 |
|
|
|
|
Inventory: Supplies & Consumables: Production Supplies |
23,129.15 |
|
|
|
Inventory: Supplies & Consumables: Consumables |
27,326.98 |
|
|
|
|
Cash or Payables |
|
50,456.13 |
Fixed production overhead (depreciation)
|
4/2/X1 | 2.4.X1 |
|
|
|
|
Work in Process: YYX1-04-0001: Depreciation |
42.32 |
|
|
|
|
PP&E: Production Machinery: Accumulated Depreciation: Machinery: 25 |
|
15.35 |
|
|
PP&E: Production Machinery: Accumulated Depreciation: Machinery: 36 |
|
13.26 |
|
|
PP&E: Production Machinery: Accumulated Depreciation: Machinery: 48 |
|
13.71 |
XYZ recognized depreciation using the units of production method (IAS 16.62).
IAS 16.62: A variety of depreciation methods can be used to allocate the depreciable amount of an asset on a systematic basis over its useful life. These methods include the straight-line method, the diminishing balance method and the units of production method. ...
While ASC 360-10-35 does not specifically mention the units of production method, this method is both systematic and rational, and thus acceptable for US GAAP reporting purposes.
ASC 360-10-35-4: The cost of a productive facility is one of the costs of the services it renders during its useful economic life. Generally accepted accounting principles (GAAP) require that this cost be spread over the expected useful life of the facility in such a way as to allocate it as equitably as possible to the periods during which services are obtained from the use of the facility. This procedure is known as depreciation accounting , a system of accounting which aims to distribute the cost or other basic value of tangible capital assets, less salvage (if any), over the estimated useful life of the unit (which may be a group of assets) in a systematic and rational manner. It is a process of allocation, not of valuation.
Up to 4/6/X1, XYZ recognized total costs of 3,294.04 until, on 4/6/X1, quality assurance technician #85 tested YYX1-04-0001 and confirmed it was complete.
As the methodology remains the same, the entries for these costs are not presented again.
The costs incurred were: technician salaries 53.52, test supplies 24.93 and depreciation of test equipment 40.23.
|
4/6/X1 | 6.4.X1 |
|
|
|
|
Inventory: WIP YYX1-04-0001: Quality Control |
118.68 |
|
|
|
|
Accrued Liabilities: Wages and Salaries: Quality Control Salaries: 85 |
|
53.52 |
|
|
Inventory: Supplies & Consumables: Test Supplies |
|
24.93 |
|
|
PP&E: Production Machinery: Accumulated Depreciation: Test Equipment: 117 |
|
40.23 |
|
Inventory: WIP YYX1-04-0001: Rent |
300.00 |
|
|
|
|
Inventory: WIP: Pre-paid Rent |
|
300.00 |
|
Inventory: Finished Goods: YYX1-04-0001 |
3,922.90 |
|
|
|
|
Inventory: WIP YYX1-04-0001 |
|
3,922.90 |
As rental cost does not lend itself to specific allocation, XYZ estimates this cost using its normal (average) annual capacity of 32,000 units and total annual rent of 9,600,000.
IAS 2.13: The allocation of fixed production overheads to the costs of conversion is based on the normal capacity of the production facilities. Normal capacity is the production expected to be achieved on average over a number of periods or seasons under normal circumstances, taking into account the loss of capacity resulting from planned maintenance. ...
ASC 330-10-30-3: ... the allocation of fixed production overheads to the costs of conversion is based on the normal capacity of the production facilities. Normal capacity refers to a range of production levels. Normal capacity is the production expected to be achieved over a number of periods or seasons under normal circumstances, taking into account the loss of capacity resulting from planned maintenance. Some variation in production levels from period to period is expected and establishes the range of normal capacity.
5/1/X1, it paid May rent.
|
5/1/X1 | 1.5.X1 |
|
|
|
|
Inventory: WIP: Pre-paid Rent |
800,000 |
|
|
|
|
Cash |
|
800,000 |
|
|
Alternatively |
|
|
XYZ could have recognized quality control and rent directly to finished goods.
|
Inventory: Finished Goods: YYX1-04-0001 |
3,922.90 |
|
|
|
|
Inventory: WIP YYX1-04-0001 |
|
3,504.22 |
|
|
Accrued Liabilities: Wages and Salaries: Quality Control Salaries: 85 |
|
53.52 |
|
|
Inventory: Supplies & Consumables: Test Supplies |
|
24.93 |
|
|
PP&E: Production Machinery: Accumulated Depreciation: Test Equipment: 117 |
|
40.23 |
|
|
Inventory: WIP Unallocated Overhead: Rent |
|
300.00 |
XYZ could have also used a separate work in process sub-account for each cost.
|
Inventory: Finished Goods: YYX1-04-0001 |
3,898.85 |
|
|
|
|
Inventory: WIP YYX1-04-0001: Direct Material |
|
635.86 |
|
|
Inventory: WIP YYX1-04-0001: Direct Wages |
|
1,412.19 |
|
|
Inventory: WIP YYX1-04-0001: Supervisor salaries |
|
322.64 |
|
|
Inventory: WIP YYX1-04-0001: Repairs and Maintenance |
|
70.67 |
|
|
Inventory: WIP YYX1-04-0001: Utilities: Electricity |
|
84.00 |
|
|
Inventory: WIP YYX1-04-0001: Utilities: Gas |
|
95.58 |
|
|
Inventory: WIP YYX1-04-0001: Utilities: Water and Sewage |
|
21.62 |
|
|
Inventory: WIP YYX1-04-0001: Utilities: Waste Removal |
|
48.79 |
|
|
Inventory: WIP YYX1-04-0001: Indirect Material: Production Supplies |
|
18.02 |
|
|
Inventory: WIP YYX1-04-0001: Indirect Material: Consumables |
|
19.87 |
|
|
Inventory: WIP YYX1-04-0001: Quality Control: Salaries |
|
53.52 |
|
|
Inventory: WIP YYX1-04-0001: Quality Control: QC Supplies |
|
24.93 |
|
|
Inventory: WIP YYX1-04-0001: Quality Control: Depreciation |
|
40.23 |
|
|
Inventory: WIP YYX1-04-0001: Depreciation |
|
774.99 |
|
|
Inventory: WIP Unallocated Overhead: Rent |
|
300.00 |
4/16/X1, XYZ sold product YYX1-04-0001 for 6,000.
|
4/16/X1 | 16.4.X1 |
|
|
|
|
Receivables: Trade Receivables |
6,000.00 |
|
|
|
|
Revenue: Goods |
|
6,000.00 |
|
Cost of Goods Sold |
3,898.85 |
|
|
|
|
Inventory: Finished Goods: YYX1-04-0001 |
|
3,898.85 |
At the end of the second quarter, XYZ prepared a cost of products sold schedule.
|
XYZ. Inc. For illustration, the schedule is presented for the single product. This also implies that both the beginning and ending balances must be zero. |
|||
|
Beginning WIP inventory |
|
0 |
|
|
Direct materials |
|
634.85 |
|
|
Direct wages |
|
1,412.19 |
|
|
Production overhead |
|
|
|
|
|
Supervisor salaries |
299.56 |
|
|
|
Repairs and maintenance |
70.67 |
|
|
|
Utilities |
249.98 |
|
|
|
Indirect Material |
37.88 |
|
|
|
Quality Control |
118.16 |
|
|
|
Depreciation |
775.55 |
|
|
|
Rent |
300.00 |
|
|
Total production overhead |
|
1,851.81 |
|
|
Ending WIP inventory |
|
(0) |
|
|
Cost of goods sold |
|
3,898.85 |
|
|
|
|
|
|
Additional considerations
Although XYZ recognizes the cost throughout the year, it actually performs all its repairs and maintenance during July and August. In year 1, it expended 2,777,098.70.
|
7/1/ - 8/31/X1 | 1.7. - 31.8.X1 |
|
|
|
|
PP&E: Maintenance and Repairs Allowance |
2,777,098.70 |
|
|
|
|
Cash |
|
2,777,098.70 |
Including the amounts recognized in X0.Q4, it had recognized costs of 2,736,458.24, leaving the allowance account with a balance of 40,640.47. In the 12 months ending 9/30/X1, it had begun 31,750 products, finished 31,150 and sold 31,000.
|
9/30/X1 | 30.9.X1 |
|
|
|
|
Cost of Goods Sold: MRO |
39,680.46 |
|
|
|
Inventory: WIP YYX1-9-2400 to YYX1-9-3000 |
768.01 |
|
|
|
Inventory: Finished Goods: YYX1-9-3001 to YYX1-9-3150 |
192.00 |
|
|
|
|
PP&E: Maintenance and Repairs Allowance |
|
40,640.47 |
Given its immateriality, the adjustment could have been taken to cost of sales.
|
Cost of Goods Sold: MRO |
40,640.47 |
|
|
|
|
PP&E: Maintenance and Repairs Allowance |
|
40,640.47 |
For the year-ended 12/31/X1, XYZ had, on the basis of estimated production volume of 32,000, recognized rent of 300.00 per unit. During the year, it had actually produced 32,250 units, making the actual rent per unit 297.67. As a result, its unallocated rent account was left with a (credit) balance of 75,000. During the year, 32,165 units had been sold.
|
12/31/X1 | 31.12.X1 |
|
|
|
|
Inventory: WIP Unallocated Production Overhead: Rent |
75,000.00 |
|
|
|
|
Inventory: Finished Goods: YYX1-12-1375 to YYX1-12-1397 |
|
197.67 |
|
|
Cost of Goods Sold: Rent |
|
74,802.33 |
Alternatively, due to its immateriality with respect to inventory, the adjustment could be taken to cost of sales.
|
12/31/X1 | 31.12.X1 |
|
|
|
|
Inventory: WIP Unallocated Production Overhead: Rent |
75,000.00 |
|
|
|
|
Cost of Goods Sold: Rent |
|
75,000.00 |
By the end of the Q3, XYZ paid advances of 600,000.00 for water and sewage and 1,200,000.00 for waste removal. During the same period, it actually incurred and recognized costs of 363,353.14 and 773,755.00. During the fourth quarter, it incurred and recognized additional costs of 469,690.70 and 832,625.18, bringing the year-end totals to 833,043.84 and 1,606,380.18, and leaving the two unallocated overhead accounts with (credit) balances of 33,043.84 and 6,380.18 respectively. 1/4/X2, XYZ paid the outstanding balances, together with the Q1-X2 advance payments.
|
12/31/X1 | 2.1.X1 |
|
|
|
|
Inventory: WIP Unallocated Overhead: Utilities: Water and Sewage |
33,043.84 |
|
|
|
Inventory: WIP Unallocated Overhead: Utilities: Waste Removal |
6,380.18 |
|
|
|
|
Liabilities: Trade Payables: Utilities: Water and Sewage |
|
33,043.84 |
|
|
Liabilities: Trade Payables: Utilities: Waste Removal |
|
6,380.18 |
|
1/4/X2 | 4.1.X2 |
|
|
|
|
Inventory: WIP Unallocated Overhead: Utilities: Water and Sewage |
200,000.00 |
|
|
|
Inventory: WIP Unallocated Overhead: Utilities: Waste Removal |
400,000.00 |
|
|
|
Liabilities: Trade Payables: Utilities: Water and Sewage |
33,043.84 |
|
|
|
Liabilities: Trade Payables: Utilities: Waste Removal |
6,380.18 |
|
|
|
|
Cash |
|
639,424.02 |
Direct costing
Like XYZ (above), ABC produces bespoke products that lend themselves to the specific identification of individual costs.
But rather than follow the white rabbit to job-costing land, it found an easier way.
In the previous illustration, XYZ applied IAS 2.23 and ASC 330-10-30-10 as written. In this illustration, ABC elected to use its already in place internal costing method, direct costing, and simply make a few adjustments. This way it could have its cake (not change its ERP) and eat it too (draft a financial report consistent with IFRS | US GAAP guidance).
As the reported result was consistent with the intent of the guidance, if not its letter, XYZ’s auditor did not object.
Technically, XYZ's auditor did object at first:
While this would be unusual in jurisdictions with a history of applying principles-based standards, such as the United States or United Kingdom, in jurisdictions accustomed to applying statutory accounting laws, such as continental Europe and Latin America, auditors tend to adopt literal, pedantic interpretations of accounting law and often carry this tendency over when applying judgment-based accounting frameworks such as IFRS and US GAAP.
Basis for Qualified Opinion
In preparing the accompanying financial statements, management elected to apply a hybrid method for inventory valuation. Under this method, direct costs (materials and labor) are specifically identified and allocated to inventory, while indirect costs (overhead) are allocated to cost of sales through end-of-period adjustments, rather than being included in inventory as required by IAS 2 “Inventories” and ASC 330 “Inventory.” In our view, this approach is not consistent with the explicit requirements of IAS 2 and ASC 330, which require that all costs of conversion, including a systematic allocation of fixed and variable production overheads, be included in the cost of inventory.
Had management applied the requirements of IAS 2 and ASC 330 as written, inventory and cost of sales may have been stated at different amounts. The effects of this departure from the standards are described in Note X to the financial statements.
Qualified Opinion
In our opinion, except for the effects of the matter described in the Basis for Qualified Opinion paragraph, the financial statements present fairly, in all material respects, the financial position of XYZ Company as of [date], and its financial performance and cash flows for the year then ended in accordance with International Financial Reporting Standards (IFRS) and United States Generally Accepted Accounting Principles (US GAAP).
Then, XYZ's mnagment presented its counteragument:
We acknowledge the auditor’s concern that the hybrid inventory valuation method may not fully align with the literal wording of IAS 2 and ASC 330. However, we respectfully disagree with the assertion that this constitutes a departure from the applicable financial reporting frameworks.
While the standards emphasize the inclusion of all production costs in inventory, they also recognize the need for practical application and faithful representation. Our hybrid method reflects this balance by specifically identifying direct costs and appropriately recognizing indirect costs through end-of-period adjustments to cost of sales.
Our internal costing system accurately tracks direct material and labor costs, which are taken directly to inventory without adjustment. Indirect costs, which are not tracked at the job level, are allocated systematically and transparently through period-end adjustments. This approach ensures that the total production costs are fully captured in the financial statements, consistent with the objective of IAS 2 and ASC 330 to present inventory at cost.
Furthermore, this method reflects the economic reality of our production process and provides a more reliable and understandable presentation of financial results. Given the lack of explicit guidance for such hybrid approaches and the practical challenges of tracking overhead at a detailed level, we believe our approach is a reasonable and sound application of professional judgment.
We also remind the auditor that, as management, we are responsible for our financial reporting. Accordingly, we will include our rebuttal and a full description of our inventory valuation method in the footnotes to the financial statements. As this method leads to objectively and demonstrably superior results and provides a more faithful representation of our financial position and its changes, we do not intend to change our approach, especially considering that any potential difference would not materially affect the financial statements.
4/1/X1, it started working on product #YYX1-04-0001 so employees #65, #53 and #72 worked on material #4 and #8. They spent 70, 80 and 45 minutes for which they were due wages of 25.00, 22.50 and 23.00.
Dr / Cr
|
4/1/X1 / 1.4.X1 |
|
|
|
|
Inventory: WIP: YYX1-04-0001: Direct Material |
61.80 |
|
|
|
|
Inventory: Raw material: #4: Lot 1 |
|
16.15 |
|
|
Inventory: Raw material: #4: Lot 2 |
|
18.65 |
|
|
Inventory: Raw material: #8: Lot 1 |
|
27.00 |
|
Inventory: WIP: YYX1-04-0001: Direct Wages |
76.42 |
|
|
|
|
Accrued Liabilities: Wages and Salaries: Production Wages: 53 |
|
30.00 |
|
Accrued Liabilities: Wages and Salaries: Production Wages: 65 |
|
29.17 |
|
|
|
Accrued Liabilities: Wages and Salaries: Production Wages: 72 |
|
17.25 |
3/10/X1 XYZ completed YYX1-04-0001 (total material: 915, total wages 1,132) and sold it for 8,000 3/25/X1.
|
3/31/X1 / 31.4.X1 |
|
|
|
|
Inventory: Finished Goods: YYX1-04-0001 |
2,047 |
|
|
|
|
Inventory: WIP: YYX1-04-0001 |
|
2,047 |
|
3/25/X1 / 25.3.X1 |
|
|
|
|
Cash |
8,000 |
|
|
| Cost of sales: Direct material |
915 |
||
|
Cost of sales: Direct wages |
1.132 |
|
|
| Revenue |
8,000 |
||
|
|
Inventory: Finished Goods: YYX1-04-0001 |
|
2,047 |
3/31/X1, XYZ recognized Q1 accruals and adjustments (electricity is invoiced quarterly; gas is paid in advance and invoiced annually).
|
3/31/X1 / 31.4.X1 |
|
|
|
|
Cost of sales: Production salaries |
2,660,910 |
||
|
Cost of sales: Repairs and Maintenance |
681,933 |
||
|
Cost of sales: Utilities |
2,089,232 |
||
|
Cost of sales: Supplies & Consumables |
266,646 |
||
|
Cost of sales: Quality control |
1,015,510 |
||
|
Cost of sales: Rent |
2,400,000 |
||
|
Cost of sales: Depreciation |
6,245,481 |
|
|
|
|
Accrued wages & salaries: Supervisors salaries |
|
2,660,910 |
|
|
Accrued wages & salaries: MRO wages |
|
368,244 |
|
|
PP&E: Spare parts inventory |
|
313,689 |
|
|
Accrued utilities: Electricity |
|
1,566,924 |
|
|
Inventory: WIP: Unallocated overhead: Utilities: Gas |
|
731,231 |
|
|
Inventory: Supplies & Consumables |
|
266,646 |
|
|
Accrued wages & salaries: QC wages & salaries |
|
1,015,510 |
|
|
Accrued rent |
|
2,400,000 |
|
|
Accumulated depreciation |
|
6,245,481 |
The spare parts specifically acquired to repair property, plant or equipment are recognized in PP&E (IAS 16.8).
While ASC 360-10-25 does not specifically address how spare parts acquired to repair PP&E should be recognized, the same procedure would be used under US GAAP.
Rather than an Unallocated overhead account in inventory, an accrual account (pre-paid expense) can be used.
4/10/X1, XYZ received an invoice for Q1 electricity 1,572,385. It paid the same day.
|
3/31/X1 / 31.4.X1 |
|
|
|
|
Accrued utilities: Electricity |
1,566,924 |
||
|
Cost of sales: Utilities |
5,461 |
|
|
|
|
Cash |
|
1,572,385 |
Accrued liabilities are estimated so the payment will usually differ from the accrual. Provided the expected difference is not significant, it would be treated as a accrual IAS 37.11.b | would not be treated as a contingency ASC 450-10-05-6. However, if the eventual difference was to exceed 20% to 25%, it might be considered an error (IAS 8.5 | ASC 250-10-20) and be adjusted retrospectively.
Standard costing
ABC manufactures indistinguishable products and measures production at standard cost.
ABC manufactures indistinguishable products and measures production at standard cost.
While specific identification is the default method for bespoke manufacturing, the standard cost method (IAS 2.21 | ASC 330-10-30-12) is the standard approach for serial manufacturing.
With modern technology making job costing feasible even in serial manufacturing environments, many companies now adopt job costing in their ERP systems, as standard costing often falls short for internal management purposes.
Given its investment in a modern ERP system, ABC did consider using job costing for financial reporting purposes. It then evaluated the costs versus benefits. It weighed the extra effort (discussed in specific identification above) to overcome an auditor’s objection against the simplicity of maintaining alignment between its job costing and financial reporting modules.
It stuck with standard costing.
Its auditor smiled.
Obviously, having been around the block a few times, ABC's chief accountant initially insisted on job costing, presenting sufficient arguments to eventually force the auditor to accept the inevitable. Getting ABC's management to change its mind would require a marginally justifiable qualification, which was not in anyone's best interest.
After allowing sufficient time to pass, the CA, over dinner with the engagement partner, said something like: "You know, you were probably right. It's not really all that much effort to use standard costs like the standards say we should. OK. We'll do that. Oh, by the way, remember last week when we had that other discussion about the methodology we were using to measure the fair value of that investment we have in those non-traded DEF shares—is there any way we could use the simplified approach you said was marginally acceptable? That would really save the team a lot of work."
Dr / Cr
4/1/X1, ABC began production of a type 123 product.
ASC 330-10-30-2 states (emphasis added): although principles for the determination of inventory costs may be easily stated, their application, particularly to such inventory items as work in process and finished goods, is difficult because of the variety of considerations in the allocation of costs and charges.
While IAS 2 does not explicitly commiserate with accountants about the difficulties they face, it does suggest an awareness of these difficulties by permitting methods that simplify the task, such as standard costing or the FIFO.
After considering both the letter and the intent of the guidance as well as the nature of its manufacturing process, which involves producing various products through multiple steps typically spanning days rather than hours, ABC decided the least difficult policy would be to recognize all standard costs in WIP immediately, when production began, except for quality control, which would be recognized at the moment production ends, immediately before the product was derecognized from WIP and recognized to finished goods.
The total standard cost of producing a type 123 product is 4,000 in that 125 of that cost is related to quality control.
|
Direct material |
|
|
|
|
|
1 unit of material #1 |
80 |
|
|
|
2 units of material #2 |
72 |
|
|
|
2 units of material #3 |
112 |
|
|
|
4 units of material #4 |
80 |
|
|
|
3 units of material #5 |
66 |
|
|
|
4 units of material #6 |
14 |
|
|
|
2 units of material #7 |
120 |
|
|
|
2 units of material #8 |
56 |
|
|
Total direct material |
|
600 |
|
|
Direct wages |
|
1,500 |
|
|
Supervisor salaries |
|
305 |
|
|
Maintenance and repairs |
|
80 |
|
|
Utilities |
|
|
|
|
|
Electricity |
100 |
|
|
|
Gas |
80 |
|
|
|
Water and sewage |
25 |
|
|
|
Waste removal |
50 |
|
|
Total utilities |
|
255 |
|
|
Indirect material |
|
|
|
|
|
Production supplies |
15 |
|
|
|
Production consumables |
20 |
|
|
Total indirect material |
|
35 |
|
|
Quality control In practice, QC is commonly a separate cost center. As a result, QC costs are generally included as a single cost item. In this example, they are broken down for illustration purposes. |
|
|
|
|
|
Technician salaries |
60 |
|
|
|
Test supplies and consumables |
25 |
|
|
|
Test equipment depreciation |
40 |
|
|
Total quality control |
|
125 |
|
|
Production machinery and equipment depreciation |
|
800 |
|
|
Rent of production facilities |
|
300 |
|
|
Total standard cost |
|
4,000 |
|
|
|
|
|
|
For illustration purposes, the number of individual costs shown has been kept to a minimum.
|
4/1/X1 | 1.4.X1 |
|
|
|
|
Inventory: Work in Process: Type 123 |
3,875 |
|
|
|
|
Inventory: Clearing Account: Raw Material |
|
600 |
|
|
Inventory: Clearing Account: Production Wages & Salaries |
|
1,805 |
|
|
PP&E: Maintenance and Repairs Allowance |
|
80 |
|
|
Inventory: Clearing Account: Utilities |
|
255 |
|
|
Inventory: Clearing Account: Supplies & Consumables |
|
35 |
|
|
Inventory: Clearing Account: Depreciation |
|
800 |
|
|
Inventory: Clearing Account: Rent |
|
300 |
4/6/X1, ABC completed production of a type 123 product.
As ASC 330-10-30-2 points out: Although principles for the determination of inventory costs may be easily stated, their application, particularly to such inventory items as work in process and finished goods, is difficult because of the variety of considerations in the allocation of costs and charges.
To apply this guidance, ABC considered that manufacturing each of its product types involves multiple steps carried over multiple days in that several product types are manufactured simultaneously.
For the purpose of determining work in process, ABC decided to recognize all production costs, except those related to quality control , at the time production begins.
Given the difficulty of determining an exact stage of completion across its entire product line, ABC concluded that the above approach would yield sufficiently accurate results at minimum cost.
Since the costs related to quality control are only incurred after production is completed, ABC decided to recognize these costs to finished goods instead of work in process.
The total standard cost of producing a type 123 product is 4,000 in that 125 of that cost is related to quality control.
|
Direct material |
|
|
|
|
|
1 unit of material #1 |
80 |
|
|
|
2 units of material #2 |
72 |
|
|
|
2 units of material #3 |
112 |
|
|
|
4 units of material #4 |
80 |
|
|
|
3 units of material #5 |
66 |
|
|
|
4 units of material #6 |
14 |
|
|
|
2 units of material #7 |
120 |
|
|
|
2 units of material #8 |
56 |
|
|
Total direct material |
|
600 |
|
|
Direct wages |
|
1,500 |
|
|
Supervisor salaries |
|
305 |
|
|
Maintenance and repairs |
|
80 |
|
|
Utilities |
|
|
|
|
|
Electricity |
100 |
|
|
|
Gas |
80 |
|
|
|
Water and sewage |
25 |
|
|
|
Waste removal |
50 |
|
|
Total utilities |
|
255 |
|
|
Indirect material |
|
|
|
|
|
Production supplies |
15 |
|
|
|
Production consumables |
20 |
|
|
Total indirect material |
|
35 |
|
|
Quality control In practice, QC is commonly a separate cost center. As a result, QC costs are generally included as a single cost item. In this example, they are broken down for illustration purposes. |
|
|
|
|
|
Technician salaries |
60 |
|
|
|
Test supplies and consumables |
25 |
|
|
|
Test equipment depreciation |
40 |
|
|
Total quality control |
|
125 |
|
|
Production machinery and equipment depreciation |
|
800 |
|
|
Rent of production facilities |
|
300 |
|
|
Total standard cost |
|
4,000 |
|
|
|
|
|
|
In practice, quality control is commonly accounted for as a separate cost center. As a result, QC costs are generally included in cost of products as single line items. In this example, they are broken down for illustration purposes.
For illustration purposes, the number of individual costs shown has been kept to a minimum.
|
4/6/X1 | 6.4.X1 |
|
|
||
|
Inventory: Finished Goods: Type 123 |
125 |
|
||
|
|
Inventory: Clearing Account: Quality Control |
|
125 |
|
|
Inventory: Finished Goods: Type 123 |
3,875 |
|
||
|
|
Inventory: Work in Process: Type 123 |
|
3,875 |
|
4/16/X1, ABC sold a type 123 product for 6,000.
|
4/16/X1 | 16.4.X1 |
|
|
|
|
Receivables: Trade Receivables |
6,000 |
|
|
|
|
Revenue: Goods |
|
6,000 |
|
Cost of Goods Sold |
4,000 |
|
|
|
|
Inventory: Finished Goods: Type 123 |
|
4,000 |
At the end of each period, ABC made the necessary adjustments.
During April, ABC began 1,570, completed 1,550 and sold 1,525 products of various types.
As it pays out actual wages and salaries each month, these costs lend themselves to monthly adjustment. At standard cost, ABC had recognized wages and salaries of 2,926,850 while actual wages and salaries were 2,817,072 in total implying a variance 109,778.
While IFRS | US GAAP requires variances to be reviewed and adjusted, it does not specify a particular periodicity.
IAS 2.21: ... Standard costs take into account normal levels of materials and supplies, labour, efficiency and capacity utilisation. They are regularly reviewed and, if necessary, revised in the light of current conditions.
ASC 330-10-30-12: Standard costs are acceptable if adjusted at reasonable intervals to reflect current conditions so that at the balance-sheet date standard costs reasonably approximate costs computed under one of the recognized bases. ...
Consequently, companies can choose to adjust costs that lend themselves to more frequent adjustment, such as wages and salaries, at different intervals than costs, such as rent or depreciation, that do not.
Production wages: 2,355,000
Supervisor salaries: 478,850
Quality control technician salaries: 93,000
Production wages: 2,266,334
Supervisor salaries: 450,732
Quality control technician salaries: 100,006
Production wages: 88,666
Supervisor salaries: 28,118
Quality control technician salaries: (7,006)
|
4/30/X1 | 30.4.X1 |
|
|
|
|
Inventory: Clearing Account: Production Wages & Salaries |
116,784 |
|
|
|
|
Inventory: Work in Process: Adjustment |
|
1,488 |
|
|
Inventory: Finished Goods: Adjustment |
|
1,860 |
|
|
Cost of Goods Sold: Direct Wages: Adjustment |
|
86,125 |
|
|
Cost of Goods Sold: Supervisor Salaries: Adjustment |
|
27,312 |
|
Cost of Goods Sold: Quality Control: Adjustment |
6,893 |
|
|
|
Inventory: Finished Goods: Adjustment |
113 |
|
|
|
|
Inventory: Clearing Account: Quality Control |
|
7,006 |
|
Inventory: Clearing Account: Production Wages & Salaries |
2,717,066 |
|
|
| Inventory: Clearing Account: Quality Control |
100,006 |
|
|
|
|
Accrued Liabilities: Wages and Salaries |
|
2,817,072 |
116,784 = (2,355,000 + 478,850) - (2,266,334 + 450,732); 1,488 = 116,784 x (1,570 - 1,550) ÷ 1,570; 1,860 = 116,784 x (1,550 - 1,525) ÷ 1,570; 113,437 = 116,784 - 1,488 -1,860; 86,125 = 113,437 x 88,666 ÷ 116,784; 27,312 = 113,437 x 28,118 ÷ 116,784
Only the wage component of quality control is adjusted each month.
(7,006) = 93,000 - 100,006; 6,893 = 7,006 x 1,525 ÷ 1,550; 113 = 7,006 x (1,550 - 1,525) ÷ 1,550
Wages and salaries were paid out on 5/2/X1.
|
5/2/X1 | 2.5.X1 |
|
|
|
|
Accrued Liabilities: Wages and Salaries |
2,817,072 |
|
|
|
|
Cash |
|
2,817,072 |
During the second quarter, ABC began 4,750, finished 4,725 and sold 4,650 units. For interim reporting purposes, ABC reviews raw material inventory each quarter.
|
6/30/X1 | 30.6.X1 |
|
|
|
|
Cost of Goods Sold: Raw Material |
107,223 |
|
|
|
Inventory: WIP: Adjustment |
576 |
|
|
|
Inventory: Finished Goods: Adjustment |
1,729 |
|
|
|
|
Inventory: Clearing Account: Raw Material |
|
109,529 |
|
Inventory: Clearing Account: Raw Material |
2,959,529 |
|
|
|
|
Inventory: Raw Material |
|
2,959,529 |
|
Raw Material |
|||||||||
|
|
Units on Hand |
Standard Cost |
Actual Cost (FIFO) |
|
|||||
|
|
Beginning |
Acquired |
Ending |
Usage |
Unit |
Total |
Unit |
Total |
Variance |
|
Material #1 |
865 |
5,000 |
(1,115) |
4,750 |
80.00 |
380,000 |
79.26 |
376,497 |
3,503 |
|
Material #2 |
281 |
10,000 |
(781) |
9,500 |
36.00 |
342,000 |
22.58 |
214,493 |
127,507 |
|
Material #3 |
151 |
10,000 |
(651) |
9,500 |
56.00 |
532,000 |
51.38 |
488,091 |
43,909 |
|
Material #4 |
10 |
22,000 |
(3,010) |
19,000 |
20.00 |
380,000 |
21.28 |
404,385 |
(24,385) |
|
Material #5 |
995 |
14,000 |
(745) |
14,250 |
22.00 |
313,500 |
18.96 |
270,243 |
43,257 |
|
Material #6 |
185 |
19,000 |
(185) |
19,000 |
3.50 |
66,500 |
12.01 |
228,133 |
(161,633) |
|
Material #7 |
280 |
12,000 |
(2,780) |
9,500 |
60.00 |
570,000 |
67.01 |
636,568 |
(66,568) |
|
Material #8 |
2,736 |
7,000 |
(236) |
9,500 |
28.00 |
266,000 |
35.91 |
341,119 |
(75,119) |
|
|
5,503 |
99,000 |
(9,503) |
95,000 |
|
2,850,000 |
|
2,959,529 |
(109,529) |
|
|
|
|
|
|
|
|
|
|
|
Alternatively, given its immateriality with respect to inventory, the adjustment could have made to just cost of sales.
|
Cost of Goods Sold: Raw Material |
109,529 |
|
|
|
|
Inventory: Clearing Account: Raw Material |
|
109,529 |
Also during the second quarter, ABC recognized electricity and gas at standard costs of 475,000 and 380,000. Based on its own estimates, it determined actual costs of 476,625 and 448,815.
|
6/30/X1 | 30.6.X1 |
|
|
|
|
Cost of Goods Sold: Utilities: Electricity |
1,591 |
|
|
|
Cost of Goods Sold: Utilities: Gas |
67,366 |
|
|
|
Inventory: WIP Adjustment |
371 |
|
|
|
Inventory: Finished Goods: Adjustment |
1,112 |
|
|
|
|
Inventory: Clearing Account: Utilities |
|
70,440 |
|
Inventory: Clearing Account: Utilities |
925,440 |
|
|
|
|
Accrued Liabilities: Utilities: Electricity |
|
476,625 |
|
|
Accrued Liabilities: Utilities: Gas |
|
448,815 |
7/2X1 and 7/4X1, ABC received electricity and gas bills of 460,148 and 445,673. As both suppliers take only annual meter readings, the invoiced amounts are based on their estimates. During the year, ABC accumulates the differences in accruals, making any necessary adjustments on the basis of final, year-end billings.
|
8/1/X1 | 1.8.X1 |
|
|
|
|
Accrued Liabilities: Utilities: Electricity |
460,148 |
|
|
|
Accrued Liabilities: Utilities: Gas |
445,673 |
|
|
|
|
Cash |
|
905,821 |
Note: As the procedure for adjusting wages and salaries remains the same, it is not shown again.
Finally, ABC pre-paid third quarter water, sewage and waste removal. It also pre-paid July rent.
|
6/30/X1 | 30.6.X1 |
|
|
|
|
Inventory: WIP Unallocated Overhead: Utilities: Water and Sewage |
200,000 |
|
|
|
Inventory: WIP Unallocated Overhead: Utilities: Waste Removal |
400,000 |
|
|
|
Inventory: WIP Unallocated Overhead: Rent |
800,000 |
|
|
|
Cash |
|
1,400,000 |
|
|
|
Alternatively | ||
|
Inventory: WIP Pre-Paid Costs: Utilities: Water and Sewage |
200,000 |
|
|
Inventory: WIP Pre-Paid Costs: Utilities: Waste Removal |
400,000 |
|
|
Inventory: WIP Pre-Paid Costs: Rent |
800,000 |
|
Although it recognizes it throughout the year, ABC performs routine repairs and maintenance annually, each July and August. In July and August of X1, it incurred actual costs of 2,777,079. In the twelve months ending 9/30/X1, it had recognized standard cost of 2,736,439, had begun 31,750 units, completed 31,150 and sold 31,000.
|
7/1/ - 8/31/X1 | 1.7. - 31.8.X1 |
|
|
|
|
PP&E: Maintenance and Repairs Allowance |
2,777,079 |
|
|
|
|
Cash |
|
2,777,079 |
|
9/30/X1 | 30.9.X1 |
|
|
|
|
Cost of Goods Sold: Maintenance and Repairs |
39,680 |
|
|
|
Inventory: WIP: Adjustment |
768 |
|
|
|
Inventory: Finished Goods: Adjustment |
192 |
|
|
|
|
PP&E: Maintenance and Repairs Allowance |
|
40,640 |
Alternatively, given its immateriality with respect to inventory, the adjustment could have made to just cost of sales.
|
Cost of Goods Sold: Maintenance and Repairs |
40,640 |
|
|
|
|
PP&E: Maintenance and Repairs Allowance |
|
40,640 |
At the end of X1, ABC determined that production supplies, at a standard cost of 483,525, quality control supplies, at 805,875, and consumables, at 644,700, had been recognized, while 460,991, 791,556 and 605,593 had actually been consumed. During X1, ABC began 32,235 finished 32,250 and sold 32,165 products.
|
12/31/X1 | 31.12.X1 |
|
|
|
|
Inventory: Clearing Account: Quality Control |
805,875 |
|
|
|
|
Inventory: Clearing Account: Supplies & Consumables |
|
805,875 |
|
Inventory: Clearing Account: Supplies & Consumables |
75,961 |
|
|
|
Inventory: WIP Adjustment |
35 |
|
|
|
|
Cost of Goods Sold: Quality Control |
|
14,288 |
|
|
Cost of Goods Sold: Indirect Material |
|
61,508 |
|
|
Inventory: Finished Goods: Adjustment |
|
200 |
During Q4, ABC recognized electricity and gas at standard costs of 1,690,000 and 1,352,000 respectively. 12/31/X1, it estimated the actual Q4 costs to be 1,847,454 and 1,273,065.
|
12/31/X1 | 31.12.X1 |
|
|
|
|
Cost of Goods Sold: Utilities |
77,822 |
|
|
|
Inventory: Finished Goods: Adjustment |
813 |
|
|
|
|
Inventory: Clearing Account: Utilities |
|
78,519 |
|
|
Inventory: WIP Adjustment |
|
116 |
|
Inventory: Clearing Account: Utilities |
3,120,519 |
|
|
|
|
Accrued Liabilities: Utilities: Electricity |
|
1,847,454 |
|
|
Accrued Liabilities: Utilities: Gas |
|
1,273,065 |
|
|
Alternatively |
|
|
|
12/31/X1 | 31.12.X1 |
|
|
|
|
Cost of Goods Sold: Utilities: Electricity |
156,057 |
|
|
|
Inventory: Clearing Account: Utilities: Gas |
78,935 |
|
|
|
Inventory: Finished Goods: Adjustment |
813 |
|
|
|
|
Inventory: Clearing Account: Utilities: Electricity |
|
157,454 |
|
|
Cost of Goods Sold: Utilities: Gas |
|
78,235 |
|
|
Inventory: WIP Adjustment |
|
116 |
For the year, ABC had recognized electricity and gas of 3,380,262 and 2,537,244. As of 12/31/X1, as it had not received fourth quarter billings, it had only paid 1,581,736 and 1,280,214, leaving its accrued electricity and accrued gas accounts with (credit) balances of 1,798,526 and 1,257,030. 1/4/X2 and 1/6/X2, ABC received final, year-end invoices for 1,878,360 and 1,226,469. As the exact amounts were known between year-end and the date financial statements were authorized for issue, per IAS 10.8 | ASC 855-10-25-1, it made the adjustments to X1.
Note: The original entries could also have been reversed.
|
12/31/X1 | 31.12.X1 / Recorded 1/4/X2 & 1/6/X2 | 4.1.X2 & 6.1.X2 |
|||
|
Accrued Liabilities: Utilities: Gas |
30,560 |
|
|
|
Cost of Goods Sold: Utilities |
49,167 |
|
|
|
Inventory: Finished Goods: Adjustment |
130 |
|
|
|
|
Accrued Liabilities: Utilities: Electricity |
|
79,834 |
|
|
Inventory: WIP Adjustment |
|
23 |
|
2/4/X2 | 4.1.X2 |
|
|
|
|
Accrued Liabilities: Utilities: Electricity |
1,878,360 |
|
|
|
Accrued Liabilities: Utilities: Gas |
1,226,469 |
|
|
|
|
Cash |
|
3,104,829 |
During the fourth quarter, water sewage of 422,500, and waste removal 845,000 had been recognized at standard cost. Actual fourth quarter costs were 469,691 and 832,625.
|
12/31/X1 | 31.12.X1 |
|
|
|
|
Cost of Goods Sold: Utilities |
34,507 |
|
|
|
Inventory: Finished Goods: Adjustment |
361 |
|
|
|
|
Inventory: Clearing Account: Utilities |
|
34,816 |
|
|
Inventory: WIP Adjustment |
|
52 |
|
|
Alternatively |
|
|
|
12/31/X1 | 31.12.X1 |
|
|
|
|
Cost of Goods Sold: Utilities: Water and Sewage |
46,772 |
|
|
|
Inventory: Clearing Account: Utilities: Waste Removal |
12,375 |
|
|
|
Inventory: Finished Goods: Adjustment |
361 |
|
|
|
|
Inventory: Clearing Account: Utilities: Water and Sewage |
|
47,191 |
|
|
Cost of Goods Sold: Utilities: Waste Removal |
|
12,265 |
|
|
Inventory: WIP Adjustment |
|
52 |
For the whole year, actual costs of 833,044 and 1,606,380 had been recognized while 800,000 and 1,600,000 had been paid. ABC remitted the outstanding balances together with its X2-Q1 pre-payments.
|
1/2/X2 | 2.1.X2 |
|
|
|
|
Inventory: WIP Unallocated Overhead: Utilities: Water and Sewage |
200,000.00 |
|
|
|
Inventory: WIP Unallocated Overhead: Utilities: Waste Removal |
400,000.00 |
|
|
|
Accrued liabilities: Utilities: Water and Sewage |
33,044 |
|
|
|
Accrued liabilities: Utilities: Waste Removal |
6,380 |
|
|
|
|
Cash |
|
639,424 |
During X1, depreciation at standard cost had been 27,077,400 while actual depreciation was 26,278,746. Of these amounts 25,788,000 and 24,981,925 were associated with production, and 1,289,400 and 1,296,821 with quality control.
|
12/31/X1 | 31.12.X1 |
|
|
|
|
Inventory: Clearing Account: Quality Control |
1,289,400 |
|
|
|
|
Inventory: Clearing Account: Depreciation |
|
1,289,400 |
|
Inventory: Clearing Account: Depreciation |
798,654 |
|
|
|
Cost of Goods Sold: Quality Control |
7,405 |
|
|
|
Inventory: WIP Adjustment |
372 |
|
|
|
|
Cost of Goods Sold: Depreciation |
|
804,325 |
|
|
Inventory: Finished Goods: Adjustment |
|
2,106 |
Finally, while rent of 9,670,500 had been recognized at standard cost, actual rent was 9,600,000.
|
12/31/X1 | 31.12.X1 |
|
|
|
|
Inventory: Clearing Account: Rent |
70,500 |
|
|
|
Inventory: WIP Adjustment |
33 |
|
|
|
|
Cost of Goods Sold: Rent |
|
70,347 |
|
|
Inventory: Finished Goods: Adjustment |
|
186 |
ABC drafted its financial statements and schedules.
|
ABC Inc. |
||||
|
|
Current |
Previous |
||
|
Current assets |
|
|
||
|
--- |
--- |
--- |
||
|
|
Inventory |
|
|
|
|
|
|
Raw material |
822,530 |
963,353 |
|
|
|
Work in process |
438,429 |
498,375 |
|
|
|
Finished Goods |
1,037,419 |
697,725 |
|
|
Total Inventory |
2,298,378 |
2,159,453 |
|
|
--- |
--- |
--- |
||
|
ABC Inc. |
||
|
Beginning finished goods inventory |
|
697,725 |
|
Cost of goods manufactured |
|
128,883,852 |
|
Ending finished goods |
|
(1,037,419) |
|
Cost of goods sold |
|
128,544,158 |
|
|
|
|
|
ABC Inc. |
|||||
|
Beginning work in process inventory |
|
|
498,375 |
||
|
|
Beginning material |
|
963,353 |
|
|
|
|
Material purchased |
|
21,335,000 |
|
|
|
|
Ending material |
|
(822,530) |
|
|
|
Direct material |
|
|
21,475,823 |
||
|
Direct wages |
|
|
45,820,536 |
||
|
Production overhead |
|
|
|
||
|
|
Supervisor's salaries |
|
10,643,641 |
|
|
|
|
Maintenance and Repairs |
|
2,727,731 |
|
|
|
|
|
Electricity |
3,460,096 |
|
|
|
|
|
Gas |
2,506,683 |
|
|
|
|
|
Water and sewage |
866,088 |
|
|
|
|
|
Waste removal |
1,612,760 |
|
|
|
|
Utilities |
|
8,445,627 |
|
|
|
|
|
Supplies |
460,991 |
|
|
|
|
|
Consumables |
605,593 |
|
|
|
|
Indirect material |
|
1,066,583 |
|
|
|
|
|
Salaries |
1,973,662 |
|
|
|
|
|
Supplies |
791,556 |
|
|
|
|
|
Depreciation |
1,296,821 |
|
|
|
|
Quality Control |
|
4,062,039 |
|
|
|
|
Depreciation |
|
24,981,925 |
|
|
|
|
Rent |
|
9,600,000 |
|
|
|
Total production overhead |
|
|
61,527,547 |
||
|
Ending work in process inventory |
|
|
(438,429) |
||
|
Cost of goods manufactured |
|
|
128,883,852 |
||
|
|
|
|
|
||
The following schedule summarizes the adjustments made in X1
|
|
Variances |
Adjustments |
|||||||
|
Standard Cost |
Actual Cost |
Clearing |
WIP |
FG |
Cost of Sales |
||||
|
|
Units |
Total |
Unit |
Total |
Dr/(Cr) |
Dr/(Cr) |
Dr/(Cr) |
Dr/(Cr) |
|
|
Direct Material |
600 |
19,341,000 |
666.23 |
21,475,823 |
(2,134,823) |
(993) |
5,629 |
2,130,187 |
|
|
Direct Wages |
1,500 |
48,352,500 |
1,421.45 |
45,820,536 |
2,531,964 |
1,178 |
(6,676) |
(2,526,466) |
|
|
Supervisor's salaries |
305 |
9,831,675 |
330.19 |
10,643,641 |
(811,966) |
(378) |
2,141 |
810,203 |
|
|
MRO |
80 |
2,578,800 |
84.62 |
2,727,731 |
(148,931) |
(69) |
393 |
148,608 |
|
|
|
Electricity |
100 |
3,223,500 |
104.86 |
3,460,096 |
(236,596) |
(110) |
624 |
236,082 |
|
|
Gas |
80 |
2,578,800 |
78.71 |
2,506,683 |
72,117 |
34 |
(190) |
(71,960) |
|
|
Water and sewage |
25 |
805,875 |
25.84 |
866,088 |
(60,213) |
(28) |
159 |
60,082 |
|
|
Waste removal |
50 |
1,611,750 |
49.83 |
1,612,760 |
(1,010) |
(0) |
3 |
1,008 |
|
Total utilities |
255 |
8,219,925 |
259.25 |
8,356,929 |
|
|
|
|
|
|
|
Supplies |
15 |
483,525 |
14.30 |
460,991 |
22,534 |
10 |
(59) |
(22,486) |
|
|
Consumables |
20 |
644,700 |
18.79 |
605,593 |
39,107 |
18 |
(103) |
(39,022) |
|
Total indirect material |
35 |
1,128,225 |
33.09 |
1,066,583 |
|
|
|
|
|
|
|
Salaries |
60 |
1,934,100 |
61.23 |
1,973,662 |
(39,562) |
(18) |
104 |
39,476 |
|
|
Supplies |
25 |
805,875 |
24.56 |
791,556 |
14,319 |
7 |
(38) |
(14,288) |
|
|
Depreciation |
40 |
1,289,400 |
40.23 |
1,296,821 |
(7,421) |
(3) |
20 |
7,405 |
|
Total quality Control |
125 |
4,029,375 |
126.01 |
4,062,039 |
|
|
|
|
|
|
Depreciation |
800 |
25,788,000 |
774.99 |
24,981,925 |
806,075 |
375 |
(2,126) |
(804,325) |
|
|
Rent |
300 |
9,670,500 |
297.67 |
9,600,000 |
70,500 |
33 |
(186) |
(70,347) |
|
|
Total |
4,000 |
128,940,000 |
3,993.65 |
128,823,906 |
116,094 |
54 |
(306) |
(115,842) |
|
|
|
|
|
|
|
|
|
|
||
498,375 + 128,823,906 - 438,429 = 128,883,852
In contrast to the previous example, ABC decided to simply its accounting by adjusting standard costs annually. To simply it even further, it also decided aggregate similar costs and eliminate some function driven items.
Dr/Cr
Each time ABC began a product, it recorded:
|
Inventory: Work in Process |
4,000 |
|
|
|
|
Inventory: Clearing Account: Raw Material |
|
600 |
|
|
Inventory: Clearing Account: Production Wages |
|
1,500 |
|
|
Inventory: Clearing Account: Production Salaries |
|
365 |
|
|
Inventory: Clearing Account: MRO |
|
80 |
|
|
Inventory: Clearing Account: Utilities |
|
255 |
|
|
Inventory: Clearing Account: Indirect material |
|
60 |
|
|
Inventory: Clearing Account: Depreciation |
|
840 |
|
|
Inventory: Clearing Account: Rent |
|
300 |
Each time ABC finished a product, it recorded:
|
1/1/X1 | 1.1.X1 - 12/31/X1 | 31.12.X1 |
|
|
|
|
Inventory: Finished goods |
4,000 |
|
|
|
|
Inventory: Work in Process |
|
4,000 |
Each time ABC sold a product, it recorded:
|
1/1/X1 | 1.1.X1 - 12/31/X1 | 31.12.X1 |
|
|
|
|
Cash or Receivable |
#,### |
|
|
|
|
Revenue: Goods |
|
#,### |
|
Cost of Goods Sold |
4,000 |
|
|
|
|
Inventory: Finished goods |
|
4,000 |
As sales prices vary, the amounts credited to revenue also vary.
Each time ABC acquired raw material, it recorded:
|
1/1/X1 | 1.1.X1 - 12/31/X1 | 31.12.X1 |
|
|
|
|
Inventory: Raw Material |
#,### |
|
|
|
|
Cash or payable |
|
#,### |
As material costs vary, the amounts debited to raw materials also vary.
Each time ABC incurred a production cost, it recorded:
|
1/1/X1 | 1.1.X1 - 12/31/X1 | 31.12.X1 |
|
|
|
|
Inventory: Clearing Account: Production Wages |
#,### |
|
|
|
Inventory: Clearing Account: Production Salaries |
#,### |
|
|
|
Inventory: Clearing Account: Maintenance and Repairs |
#,### |
|
|
|
Inventory: Clearing Account: Utilities |
#,### |
|
|
|
Inventory: Clearing Account: Supplies & Consumables |
#,### |
|
|
|
Inventory: Clearing Account: Rent |
#,### |
|
|
|
|
Cash, payable, allowance, etc. |
|
#,### |
As with sales prices and material costs, these costs also vary.
At year-end, ABC took stock of its raw material and determined 21,475,823 was on hand.
|
|
Beginning |
Purchases |
Ending |
Usage |
|
Material #1 |
63,750 |
2,570,000 |
(192,224) |
2,441,526 |
|
Material #2 |
218,785 |
1,592,000 |
(82,393) |
1,728,392 |
|
Material #3 |
256,050 |
2,450,000 |
(260,335) |
2,445,715 |
|
Material #4 |
99,000 |
3,308,000 |
(120,335) |
3,286,665 |
|
Material #5 |
59,000 |
2,791,000 |
(43,562) |
2,806,438 |
|
Material #6 |
12,250 |
3,170,500 |
(23,727) |
3,159,023 |
|
Material #7 |
178,750 |
2,892,500 |
(9,976) |
3,061,274 |
|
Material #8 |
75,768 |
2,561,000 |
(89,978) |
2,546,790 |
|
|
963,353 |
21,335,000 |
(822,530) |
21,475,823 |
|
|
||||
|
12/31/X1 | 31.12.X1 |
|
|
|
|
Inventory: Clearing Account: Raw Material |
21,475,823 |
|
|
|
|
Inventory: Raw Material |
|
21,475,823 |
Also at year-end, ABC determined that depreciation, attributable to production, was 26,278,746.
|
12/31/X1 | 31.12.X1 |
|
|
|
|
Inventory: Clearing Account: Depreciation |
26,278,746 |
|
|
|
|
PP&E: Accumulated Depreciation |
|
26,278,746 |
During X1, including material and depreciation, ABC recognized total standard costs of 128,940,000 and recorded total actual costs of 128,735,208. This left its clearing accounts with an aggregate (credit) balance of 204,792.
|
Production Costs |
Standard Cost |
Actual Cost |
Clearing Account |
|
Direct Material |
19,341,000 |
21,475,823 |
2,134,823 |
|
Direct Wages |
48,352,500 |
45,820,536 |
(2,531,964) |
|
Production salaries |
11,765,775 |
12,617,303 |
851,528 |
|
Repairs and Maintenance |
2,578,800 |
2,727,731 |
148,931 |
|
Utilities |
8,219,925 |
8,356,929 |
137,004 |
|
Supplies & Consumables |
1,934,100 |
1,858,139 |
(75,961) |
|
Depreciation |
27,077,400 |
26,278,746 |
(798,654) |
|
Rent |
9,670,500 |
9,600,000 |
(70,500) |
|
Total costs |
128,940,000 |
128,735,208 |
(204,792) |
|
|
|
|
|
During X1, ABC had begun 32,235, finished 32,250 and sold 32,165 products and made the adjustments.
|
12/31/X1 | 31.12.X1 |
|
|
|
|
Inventory: Clearing Account: Production Wages |
2,531,964 |
|
|
|
Inventory: Clearing Account: Supplies & Consumables |
75,961 |
|
|
|
Inventory: Clearing Account: Depreciation |
798,654 |
|
|
|
Inventory: Clearing Account: Rent |
70,500 |
|
|
|
Inventory: WIP Adjustment |
95 |
|
|
|
|
Inventory: Clearing Account: Raw Material |
|
2,134,823 |
|
|
Inventory: Clearing Account: Production Salaries |
|
851,528 |
|
|
Inventory: Clearing Account: Maintenance & Repairs |
|
148,931 |
|
|
Inventory: Clearing Account: Utilities |
|
137,004 |
|
|
Inventory: Finished Goods: Adjustment |
|
540 |
|
|
Cost of Goods Sold: Adjustment |
|
204,347 |
|
|
Alternatively |
|
|
|
Adjustments |
Clearing |
WIP |
FG |
COGS |
|
Direct Material |
(2,134,823) |
(993) |
5,629 |
2,130,187 |
|
Direct Wages |
2,531,964 |
1,178 |
(6,676) |
(2,526,466) |
|
Production salaries |
(851,528) |
(396) |
2,245 |
849,679 |
|
Repairs and Maintenance |
(148,931) |
(69) |
393 |
148,608 |
|
Utilities |
(137,004) |
(64) |
361 |
136,707 |
|
Supplies & Consumables |
75,961 |
35 |
(200) |
(75,796) |
|
Depreciation |
798,654 |
372 |
(2,106) |
(796,920) |
|
Rent |
70,500 |
33 |
(186) |
(70,347) |
|
Total Adjustments |
204,792 |
95 |
(540) |
(204,347) |
|
|
|
|
|
|
|
|
Inventory: Clearing Account: Production Wages |
2,531,964 |
|
|
|
|
Inventory: Clearing Account: Supplies & Consumables |
75,961 |
|
|
|
|
Inventory: Clearing Account: Depreciation |
798,654 |
|
|
|
|
Inventory: Clearing Account: Rent |
70,500 |
|
|
|
|
Inventory: WIP Adjustment |
95 |
|
|
|
|
Cost of Goods Sold: Direct Material: Adjustment |
2,130,187 |
|
|
|
|
Cost of Goods Sold: Salaries: Adjustment |
849,679 |
|
|
|
|
Cost of Goods Sold: Repairs and Maintenance: Adjustment |
148,608 |
|
|
|
|
Cost of Goods Sold: Utilities: Adjustment |
136,707 |
|
|
|
|
|
Inventory: Clearing Account: Raw Material |
|
2,134,823 |
|
|
|
Inventory: Clearing Account: Production Salaries |
|
851,528 |
|
|
|
Inventory: Clearing Account: Maintenance & Repairs |
|
148,931 |
|
|
|
Inventory: Clearing Account: Utilities |
|
137,004 |
|
|
|
Inventory: Finished Goods: Adjustment |
|
540 |
|
|
|
Cost of Goods Sold: Direct Wages: Adjustment |
|
2,526,466 |
|
|
|
Cost of Goods Sold: Supplies & Consumables: Adjustment |
|
75,796 |
|
|
|
Cost of Goods Sold: Depreciation: Adjustment |
|
796,920 |
|
|
|
Cost of Goods Sold: Rent: Adjustment |
|
70,347 |
|
1/2/X2 | 2.1.X2 |
|
|
|
|
Inventory: WIP Unallocated Overhead: Utilities: Water and Sewage |
200,000.00 |
|
|
|
Inventory: WIP Unallocated Overhead: Utilities: Waste Removal |
400,000.00 |
|
|
|
Equity: Retained Earnings |
39,424 |
|
|
|
|
Cash |
|
639,424 |
|
ABC Inc. |
||||
|
|
Ending |
Beginning |
||
|
Current assets |
|
|
||
|
--- |
--- |
--- |
||
|
|
Inventory |
|
|
|
|
|
|
Raw material |
822,530 |
963,353 |
|
|
|
Work in process |
438,470 |
498,375 |
|
|
|
Finished Goods |
1,037,185 |
697,725 |
|
|
Total Inventory |
2,298,185 |
2,159,453 |
|
|
--- |
--- |
--- |
||
|
ABC Inc. |
||
|
Beginning finished goods inventory |
|
697,725 |
|
Cost of goods manufactured |
|
128,795,113 |
|
Ending finished goods |
|
(1,037,185) |
|
Cost of goods sold |
|
128,455,653 |
|
--- |
|
--- |
|
ABC Inc. |
|||
|
Beginning work in process inventory |
|
498,375 |
|
|
|
Beginning material |
963,353 |
|
|
|
Material purchased |
21,335,000 |
|
|
|
Ending material |
(822,530) |
|
|
Direct material |
|
21,475,823 |
|
|
Direct wages |
|
45,820,536 |
|
|
Production overhead |
|
|
|
|
|
Salaries |
12,617,303 |
|
|
|
Maintenance and Repairs |
2,727,731 |
|
|
|
Utilities |
8,356,929 |
|
|
|
Indirect material |
1,858,139 |
|
|
|
Depreciation |
26,278,746 |
|
|
|
Rent |
9,600,000 |
|
|
Total production overhead |
|
61,438,849 |
|
|
Ending work in process inventory |
|
(438,470) |
|
|
Cost of goods manufactured |
|
128,795,113 |
|
|
|
|
|
|
Finally, instead of adjusting X1 to recognize the costs that were estimated, it simply recorded them in X2.
|
1/4/X2 | 4/1/X2 |
|
|
|
|
Equity: Retained Earnings |
79,834 |
|
|
|
|
Accrued Liabilities: Utilities: Electricity |
|
79,834 |
|
1/6/X2 | 6.1.X2 |
|
|
|
|
Accrued Liabilities: Utilities: Gas |
30,561 |
|
|
|
|
Equity: Retained Earnings |
|
30,561 |
Also see:
IFRS | US GAAP versus national GAAP
ABC is a wholly owned subsidiary of XYZ and a legal entity domiciled in a continental European country. Rather than reconcile one standard to the other, XYZ maintains two, parallel reporting systems.
Dr/Cr
Each time ABC received a supplier invoice it recorded:
|
1/1/X1 | 1.1.X1 - 12/31/X1 | 31.12.X1 |
|
|
|
|
IFRS | US GAAP |
|
|
|
|
-- |
-- |
-- |
|
|
National GAAP |
|
|
|
|
Account 111 - Cost of material |
#,### |
|
|
|
|
Account 321 - Trade payables |
|
#,### |
The amount is not shown because it varies with purchase by purchase.
It is omitted from the following entries for similar reasons.
Each time ABC acquired raw material it recorded:
|
1/1/X1 | 1.1.X1 - 12/31/X1 | 31.12.X1 |
|
|
|
|
IFRS | US GAAP |
|
|
|
|
Inventory: Raw Material |
#,### |
|
|
|
|
Cash or Accounts payable |
|
#,### |
|
National GAAP |
|
|
|
|
Account 112 - Materials in inventory |
#,### |
|
|
|
|
Accounts 111 - Cost of material or 211 - Cash on hand |
|
#,### |
Each time ABC used material in production it recorded:
|
1/1/X1 | 1.1.X1 - 12/31/X1 | 31.12.X1 |
|
|
|
|
IFRS | US GAAP |
|
|
|
|
Inventory: Work in Process |
#,### |
|
|
|
|
Inventory: Raw Material |
|
#,### |
|
National GAAP |
|
|
|
|
Account 501 - Materials expense |
#,### |
|
|
|
|
Account 112 - Materials in inventory |
|
#,### |
Each time ABC paid wages, incurred or accrued a production cost other than material it recorded:
|
1/1/X1 | 1.1.X1 - 12/31/X1 | 31.12.X1 |
|
|
|
|
IFRS | US GAAP |
|
|
|
|
Inventory: Clearing Account: Production Wages |
#,### |
|
|
|
Inventory: Clearing Account: Production Salaries |
#,### |
|
|
|
Inventory: Clearing Account: Maintenance and Repairs |
#,### |
|
|
|
Inventory: Clearing Account: Utilities |
#,### |
|
|
|
Inventory: Clearing Account: Supplies & Consumables |
#,### |
|
|
|
Inventory: Clearing Account: Rent |
#,### |
|
|
|
|
Cash, payable, accrual, allowance, etc. |
|
#,### |
|
National GAAP |
|
|
|
|
Account 521.1 - Wages and salaries expense - wages sub-account |
#,### |
|
|
|
Account 521.2 - Wages and salaries expense - salaries sub-account |
#,### |
|
|
|
Account 524 - Social security and health insurance expense |
#,### |
|
|
|
Account 511 - Repairs and maintenance expense |
#,### |
|
|
|
Accounts 502 - Energy or 503 - Other utilities expense |
#,### |
|
|
|
Account 501.2 - Materials - consumables sub-account |
#,### |
|
|
|
Account 518 - Other services |
#,### |
|
|
|
Account 5xx - Other expense account |
#,### |
|
|
|
|
Account 112 - Materials in inventory |
|
#,### |
Each time ABC began a product, it recorded:
|
1/10/X1 | 10.1.X1 |
|
|
|
|
IFRS | US GAAP |
|
|
|
|
Inventory: Work in Process |
4,000 |
|
|
|
|
Inventory: Clearing Account: Production Wages |
|
600 |
|
|
Inventory: Clearing Account: Production Salaries |
|
1,500 |
|
|
Inventory: Clearing Account: MRO |
|
365 |
|
|
Inventory: Clearing Account: Utilities |
|
80 |
|
|
Inventory: Clearing Account: Supplies & Cons. |
|
255 |
|
|
Inventory: Clearing Account: Rent |
|
60 |
|
|
Inventory: Clearing Account: Production Wages |
|
840 |
|
|
Inventory: Clearing Account: Production Salaries |
|
300 |
|
National GAAP |
|
|
|
|
-- |
-- |
-- |
|
Each time ABC finished a product, it recorded:
|
1/1/X1 | 1.1.X1 - 12/31/X1 | 31.12.X1 |
|
|
|
|
IFRS | US GAAP |
|
|
|
|
Inventory: Finished goods |
4,000 |
|
|
|
|
Inventory: Work in Process |
|
4,000 |
|
National GAAP |
|
|
|
|
-- |
-- |
-- |
|
During the period, it determined that costs of 150,000 were applicable to work in process and activated (capitalized) them. Next it determined that, of the work in process, 150,000 had progressed sufficiently to warrant reclassification as semi-finished goods. Next it determined that of the costs incurred and expensed during the period another 50,000 were applicable to semi-finished goods. Next it determined that, of the goods semi-finished, 200,000 were finished at an additional cost of 75,000.
|
1/31/X1 | 31.1.X1 |
|
|
|
|
IFRS | US GAAP |
|
|
|
|
-- |
-- |
-- |
|
|
National GAAP |
|
|
|
|
121 - Work in process |
150,000 |
|
|
|
|
Account 611 - Change in work in progress |
|
150,000 |
|
Account 611 - Change in work in progress |
150,000 |
|
|
|
|
121 - Work in process |
|
150,000 |
|
Account 122 - Semi-finished goods |
150,000 |
|
|
|
|
Account 612 - Change in semi-finished goods |
|
150,000 |
|
Account 122 - Semi-finished goods |
50,000 |
|
|
|
|
Account 612 - Change in semi-finished goods |
|
50,000 |
|
Account 612 - Change in semi-finished goods |
200,000 |
|
|
|
|
Account 122 - Semi-finished goods |
|
200,000 |
|
Account 123 - Products |
200,000 |
|
|
|
|
Account 613 - Change in products |
|
200,000 |
|
Account 123 - Products |
75,000 |
|
|
|
|
Account 613 - Change in products |
|
75,000 |
Each time ABC sold a product, it recorded:
|
1/1/X1 | 1.1.X1 - 12/31/X1 | 31.12.X1 |
|
|
|
|
IFRS | US GAAP |
|
|
|
|
Cash or Receivables: Trade receivables |
##,### |
|
|
|
|
Revenue: Goods Inventory: Finished goods |
|
##,### |
|
Cost of goods sold |
4,000 |
|
|
|
|
Inventory: Finished goods |
|
4,000 |
|
National GAAP |
|
|
|
|
Accounts 211 - Cash on hand, 221 - Cash in bank or 311 - Trade receivables |
4,000 |
|
|
|
|
601 - Product revenue |
|
4,000 |
Products valued at 275,000 had been sold during the period:
|
1/1/X1 | 1.1.X1 - 12/31/X1 | 31.12.X1 |
|
|
|
|
IFRS | US GAAP |
|
|
|
|
-- |
-- |
-- |
|
|
National GAAP |
|
|
|
|
Account 613 - Change in products |
275,000 |
|
|
|
|
Account 123 - Products |
|
275,000 |
Normal capacity
During X1, XYZ sold 2000, 2500, 1500 and 4000 units in each quarter for 40 per unit. Unit costs were 3 (material), 5 (wages) and 2 (variable overhead). Annual fixed overhead was 100,000. Had it allocated fixed costs to actual capacity, its reported results would have been. As it allocated them to normal capacity instead, its results were.
Had XYZ allocated fixed costs without any adjustment, it would have reported:
|
P |
Material |
Wages |
Variable OH |
Fixed OH |
Cost of sales |
Revenue |
Gross profit |
|
|
A |
B |
C |
D |
E |
F |
E - F = G |
|
Q1 |
6,000 |
10,000 |
4,000 |
25,000 |
45,000 |
80,000 |
35,000 |
|
Q2 |
7,500 |
12,500 |
5,000 |
25,000 |
50,000 |
100,000 |
50,000 |
|
Q3 |
4,500 |
7,500 |
3,000 |
25,000 |
40,000 |
60,000 |
20,000 |
|
Q4 |
12,000 |
20,000 |
8,000 |
25,000 |
65,000 |
160,000 |
95,000 |
|
X1 |
30,000 |
50,000 |
20,000 |
100,000 |
200,000 |
400,000 |
200,000 |
Reported gross profit in each of the four periods would have been a volatile 44%, 50%, 33% and 59%.
Allocating fixed overhead on the basis of the normal capacity reduces volatility in cost of sales and gross profit.
IFRS | US GAAP requires entities to allocate fixed overhead on the basis of the normal capacity.
Win. Win.
The only drawback, as written, the guidance (for reasons outlined above) makes it seem more involved than it is.
IAS 2.13 (edited) states: The allocation of fixed production overheads to the costs of conversion is based on the normal capacity of the production facilities. Normal capacity is the production expected to be achieved on average over a number of periods or seasons under normal circumstances, taking into account the loss of capacity resulting from planned maintenance.
Opting for a quantum more of superfluous expatiation, ASC 330-10-30-3 to 5 state: For example, variable production overheads are allocated to each unit of production on the basis of the actual use of the production facilities. However, the allocation of fixed production overheads to the costs of conversion is based on the normal capacity of the production facilities. Normal capacity refers to a range of production levels. Normal capacity is the production expected to be achieved over a number of periods or seasons under normal circumstances, taking into account the loss of capacity resulting from planned maintenance. Some variation in production levels from period to period is expected and establishes the range of normal capacity. The range of normal capacity will vary based on business- and industry-specific factors. Judgment is required to determine when a production level is abnormally low (that is, outside the range of expected variation in production). Examples of factors that might be anticipated to cause an abnormally low production level include significantly reduced demand, labor and materials shortages, and unplanned facility or equipment downtime.
After adjusting fixed costs to reflect normal capacity the results were:
2000 ÷ 10000 = 20%, 2500 ÷ 10000 = 25%, 1500 ÷ 10000 = 15% and 4000 ÷ 10000 = 40%
|
P |
Material |
Wages |
Variable OH |
Fixed OH |
Cost of sales |
Revenue |
Gross profit |
|
|
A |
B |
C |
D |
E |
F |
E - F = G |
|
Q1 |
6,000 |
10,000 |
4,000 |
20,000 |
40,000 |
80,000 |
40,000 |
|
Q2 |
7,500 |
12,500 |
5,000 |
25,000 |
50,000 |
100,000 |
50,000 |
|
Q3 |
4,500 |
7,500 |
3,000 |
15,000 |
30,000 |
60,000 |
30,000 |
|
Q4 |
12,000 |
20,000 |
8,000 |
40,000 |
80,000 |
160,000 |
80,000 |
|
X1 |
30,000 |
50,000 |
20,000 |
100,000 |
200,000 |
400,000 |
200,000 |
Reported gross profit was thus a pleasantly stable 50% across all four periods.
|
3/31/X1 | 31.4.X1 |
|
|
|
|
Inventory: Products |
20,000 |
|
|
|
|
Accumulated Depreciation |
|
20,000 |
|
6/30/X1 | 30.6.X1 |
|
|
|
|
Inventory: Products |
25,000 |
|
|
|
|
Accumulated Depreciation |
|
25,000 |
|
9/30/X1 | 30.9.X1 |
|
|
|
|
Inventory: Products |
15,000 |
|
|
|
|
Accumulated Depreciation |
|
15,000 |
|
12/31/X1 | 31.12.X1 |
|
|
|
|
Inventory: Products |
40,000 |
|
|
|
|
Accumulated Depreciation |
|
40,000 |
|
|
Alternatively |
|
|
|
Using an adjustment account |
|||
|
Inventory: Products |
20,000 |
|
|
|
Inventory: Normal capacity adjustment |
5,000 |
|
|
|
|
Accumulated Depreciation |
|
25,000 |
|
Inventory: Products |
25,000 |
|
|
|
|
Accumulated Depreciation |
|
25,000 |
|
Inventory: Products |
15,000 |
|
|
|
Inventory: Normal capacity adjustment |
10,000 |
|
|
|
|
Accumulated Depreciation |
|
25,000 |
|
Inventory: Products |
40,000 |
|
|
|
|
Accumulated Depreciation |
|
25,000 |
|
|
Inventory: Normal capacity adjustment |
|
15,000 |
Cost flows
FIFO
XYZ began selling merchandise type 123 at the beginning of X0. In X0 and X1, it made one purchase each quarter. Merchandise type 123's manufacturer introduces a new product annually, then gradually reduces its price until the next model year. The table below summarizes XYZ's quarterly purchases/cost and sales/revenue.
For the sake of simplicity, this example assumes that only one type of merchandise is bought, sold and kept in stock.
For illustration purposes, individual transactions are aggregated cost of sales recognized annually.
|
Period |
Unit purchases |
Unit cost |
Total cost |
Unit sales |
Unit price |
Total revenue |
|
|
A |
B |
C = A x B |
D |
E |
F = D x E |
|
Q1/X0 |
2,000 |
11 |
22,000 |
1,800 |
22 |
39,600 |
|
Q2/X0 |
1,000 |
10 |
10,000 |
1,100 |
20 |
22,000 |
|
Q3/X0 |
4,000 |
15 |
60,000 |
3,400 |
30 |
102,000 |
|
Q4/X0 |
5,000 |
13 |
65,000 |
5,400 |
24 |
129,600 |
|
X0 |
12,000 |
|
157,000 |
11,700 |
|
293,200 |
|
|
|
|
|
|
|
|
|
Q1/X1 |
2,500 |
12 |
30,000 |
2,200 |
24 |
52,800 |
|
Q2/X1 |
1,500 |
11 |
16,500 |
1,600 |
22 |
35,200 |
|
Q3/X1 |
3,000 |
16 |
48,000 |
2,500 |
32 |
80,000 |
|
Q4/X1 |
4,000 |
14 |
56,000 |
4,900 |
26 |
127,400 |
|
X1 |
11,000 |
|
150,500 |
11,200 |
|
295,400 |
|
|
|
|
|
|
|
|
XYZ determined X1 cost of goods sold using the first-in, first-out method.
3,900 = (0 + 12,000 - 11,700) x 13
1,400 = (300 + 11,000 - 11,200) x 14
|
1/1/X1 - 12/31/X1 | 1.1.X1 - 31.12.X1 |
|
|
|
|
Inventory: Purchases: Merchandise: Type 123 |
150,500 |
|
|
|
|
Cash or Trade Payables |
|
150,500 |
|
1/1/X1 - 12/31/X1 | 1.1.X1 - 31.12.X1 |
|
|
|
|
Cash |
295,400 |
|
|
|
|
Sales (revenue) |
|
295,400 |
|
12/31/X1 | 31.12.X1 |
|
|
|
|
Inventory: Merchandise: Type 123 |
150,500 |
|
|
|
|
Inventory: Purchases: Merchandise: Type 123 |
|
150,500 |
|
12/31/X1 | 31.12.X1 |
|
|
|
|
Cost of goods sold |
153,000 |
|
|
|
|
Inventory: Merchandise: Type 123 |
|
153,000 |
|
1/1/X1 inventory: |
3,900 |
|
X1 purchases: |
150,500 |
|
12/31/X1 inventory: |
(1,400) |
|
Cost of goods sold: |
153,000 |
|
XYZ Inc. |
|
|
Sales |
295,400 |
|
Cost of Goods Sold |
153,000 |
|
Gross profit |
142,400 |
For illustration purposes, only the sales of merchandise 123 are presented.
Weighted average
XYZ began selling merchandise type 123 at the beginning of X0. In X0 and X1, it made one purchase each quarter. Merchandise type 123's manufacturer introduces a new product annually, then gradually reduces its price until the next model year. The table below summarizes XYZ's quarterly purchases/cost and sales/revenue.
For the sake of simplicity, this example assumes that only one type of merchandise is bought, sold and kept in stock.
For illustration purposes, individual transactions are aggregated cost of sales recognized annually.
|
Period |
Unit purchases |
Unit cost |
Total cost |
Unit sales |
Unit price |
Total revenue |
|
|
A |
B |
C = A x B |
D |
E |
F = D x E |
|
Q1/X0 |
2,000 |
11 |
22,000 |
1,800 |
22 |
39,600 |
|
Q2/X0 |
1,000 |
10 |
10,000 |
1,100 |
20 |
22,000 |
|
Q3/X0 |
4,000 |
15 |
60,000 |
3,400 |
30 |
102,000 |
|
Q4/X0 |
5,000 |
13 |
65,000 |
5,400 |
24 |
129,600 |
|
X0 |
12,000 |
|
157,000 |
11,700 |
|
293,200 |
|
|
|
|
|
|
|
|
|
Q1/X1 |
2,500 |
12 |
30,000 |
2,200 |
24 |
52,800 |
|
Q2/X1 |
1,500 |
11 |
16,500 |
1,600 |
22 |
35,200 |
|
Q3/X1 |
3,000 |
16 |
48,000 |
2,500 |
32 |
80,000 |
|
Q4/X1 |
4,000 |
14 |
56,000 |
4,900 |
26 |
127,400 |
|
X1 |
11,000 |
|
150,500 |
11,200 |
|
295,400 |
XYZ determined X1 cost of goods sold using the weighted average cost method.
|
Period |
Unit purchases |
Unit cost |
Available for sale |
|
|
A |
B |
C = A x B |
|
1/1/X0 |
- |
- |
0 |
|
Q1/X0 |
2,000 |
11.00 |
22,000 |
|
Q2/X0 |
1,000 |
10.00 |
10,000 |
|
Q3/X0 |
4,000 |
15.00 |
60,000 |
|
Q4/X0 |
5,000 |
13.00 |
65,000 |
|
31/12/X0 |
12,000 |
|
157,000 |
X0 weighted average: 157,000 ÷ 12,000 = 13.08
|
Period |
Unit purchases |
Unit cost |
Available for sale |
|
|
A |
B |
C = A x B |
|
1/1/X1 |
300 |
13.08 |
3,925 |
|
Q1/X1 |
2,500 |
12.00 |
30,000 |
|
Q2/X1 |
1,500 |
11.00 |
16,500 |
|
Q3/X1 |
3,000 |
16.00 |
48,000 |
|
Q4/X1 |
4,000 |
14.00 |
56,000 |
|
31/12/X1 |
11,300 |
|
154,425 |
X1 weighted average: 154,425 ÷ 11,300 = 13.67
Alternatively, XYZ could have calculated:
|
Period |
Units |
Weight |
Per unit |
Weighted average price |
|
|
A |
B = A ÷ Σ A |
C |
D = B x C, Σ D |
|
1/1/X1 |
300 |
2.7% |
13.08 |
0.35 |
|
Q1/X1 |
2,500 |
22.1% |
12.00 |
2.65 |
|
Q2/X1 |
1,500 |
13.3% |
11.00 |
1.46 |
|
Q3/X1 |
3,000 |
26.5% |
16.00 |
4.25 |
|
Q4/X1 |
4,000 |
35.4% |
14.00 |
4.96 |
|
31/12/X1 |
11,300 |
|
|
13.67 |
|
1/1/X1 - 12/31/X1 | 1.1.X1 - 31.12.X1 |
|
|
|
|
Inventory: Purchases: Merchandise: Type 123 |
150,500 |
|
|
|
|
Cash or Trade Payables |
|
150,500 |
|
1/1/X1 - 12/31/X1 | 1.1.X1 - 31.12.X1 |
|
|
|
|
Cash |
295,400 |
|
|
|
|
Sales (revenue) |
|
295,400 |
|
12/31/X1 | 31.12.X1 |
|
|
|
|
Inventory: Merchandise: Type 123 |
150,500 |
|
|
|
|
Inventory: Purchases: Merchandise: Type 123 |
|
150,500 |
|
12/31/X1 | 31.12.X1 |
|
|
|
|
Cost of goods sold |
153,058 |
|
|
|
|
Inventory: Merchandise: Type 123 |
|
153,058 |
|
1/1/X1 inventory: |
3,925 |
|
X1 purchases: |
150,500 |
|
12/31/X1 inventory: |
(1,367) |
|
Cost of sales: |
153,058 |
3,925 = 300 x 13.08
1,367 = 100 x 13.67
|
XYZ Inc. |
|
|
Sales |
295,400 |
|
Cost of Goods Sold |
153,058 |
|
Gross profit |
142,342 |
For illustration purposes, only the sales of merchandise 123 are presented.
LIFO
XYZ began selling merchandise type 123 at the beginning of X0. In X0 and X1, it made one purchase each quarter. Merchandise type 123's manufacturer introduces a new product annually, then gradually reduces its price until the next model year. The table below summarizes XYZ's quarterly purchases/cost and sales/revenue.
For the sake of simplicity, this example assumes that only one type of merchandise is bought, sold and kept in stock.
For illustration purposes, individual transactions are aggregated cost of sales recognized annually.
|
Period |
Unit purchases |
Unit cost |
Total cost |
Unit sales |
Unit price |
Total revenue |
|
|
A |
B |
C = A x B |
D |
E |
F = D x E |
|
Q1/X0 |
2,000 |
11 |
22,000 |
1,800 |
22 |
39,600 |
|
Q2/X0 |
1,000 |
10 |
10,000 |
1,100 |
20 |
22,000 |
|
Q3/X0 |
4,000 |
15 |
60,000 |
3,400 |
30 |
102,000 |
|
Q4/X0 |
5,000 |
13 |
65,000 |
5,400 |
24 |
129,600 |
|
X0 |
12,000 |
|
157,000 |
11,700 |
|
293,200 |
|
|
|
|
|
|
|
|
|
Q1/X1 |
2,500 |
12 |
30,000 |
2,200 |
24 |
52,800 |
|
Q2/X1 |
1,500 |
11 |
16,500 |
1,600 |
22 |
35,200 |
|
Q3/X1 |
3,000 |
16 |
48,000 |
2,500 |
32 |
80,000 |
|
Q4/X1 |
4,000 |
14 |
56,000 |
4,900 |
26 |
127,400 |
|
X1 |
11,000 |
|
150,500 |
11,200 |
|
295,400 |
XYZ determined X1 cost of goods sold using the last-in, first-out method (US GAAP only).
In addition to first-in first-out and weighted average, ASC 330-10-30-30-9 allows last-in first-out.
IAS 2.25 does not allow last-in first-out.
|
Period |
Unit purch. |
Unit sales |
Unit cost |
Purch. |
LIFO layer |
Change in Inventory |
Cost of sales |
|
|
A |
B |
C |
D = A x C |
E |
F = (A – B) x C |
H = D - F |
|
1/1/X0 |
|
|
|
|
|
0 |
|
|
Q1/X0 |
2,000 |
1,800 |
11 |
(22,000) |
Y0.Q1 |
2,200 |
(19,800) |
|
Q2/X0 |
1,000 |
1,100 |
10 |
(10,000) |
Y0.Q1 |
(1,100) |
(11,100) |
|
Q3/X0 |
4,000 |
3,400 |
15 |
(60,000) |
Y0.Q3 |
9,000 |
(51,000) |
|
Q4/X0 |
5,000 |
5,400 |
13 |
(65,000) |
Y0.Q3 |
(6,000) |
(71,000) |
|
31/12/X0 |
|
|
|
(157,000) |
|
4,100 |
(152,900) |
|
1/1/X1 |
|
|
|
|
|
4,100 |
|
|
Q1/X1 |
2,500 |
2,200 |
12 |
(30,000) |
Y1.Q1 |
3,600 |
(26,400) |
|
Q2/X1 |
1,500 |
1,600 |
11 |
(16,500) |
Y1.Q1 |
(1,100) |
(17,600) |
|
Q3/X1 |
3,000 |
2,500 |
16 |
(48,000) |
Y1.Q3 |
8,000 |
(40,000) |
|
Q4/X1 |
4,000 |
4,900 |
14 |
(56,000) |
Y1.Q3 |
(8,000) |
- |
|
- |
- |
- |
- |
- |
Y1.Q1 |
(2,400) |
- |
|
- |
- |
- |
- |
- |
Y0.Q3 |
(3,000) |
(69,400) |
|
31/12/X1 |
|
|
|
(150,500) |
|
1,200 |
(153,400) |
|
1/1/X1 - 12/31/X1 |
|
|
|
|
Inventory: Purchases: Merchandise: Type 123 |
150,500 |
|
|
|
|
Cash or Trade Payables |
|
150,500 |
|
1/1/X1 - 12/31/X1 |
|
|
|
|
Cash |
295,400 |
|
|
|
|
Sales (revenue) |
|
295,400 |
|
12/31/X1 |
|
|
|
|
Inventory: Merchandise: Type 123 |
153,000 |
|
|
|
|
Inventory: Purchases: Merchandise: Type 123 |
|
153,000 |
|
12/31/X1 |
|
|
|
|
Cost of goods sold |
153,000 |
|
|
|
|
Inventory: Merchandise: Type 123 |
|
153,000 |
|
1/1/X1 inventory: |
4,100 |
|
X1 purchases: |
150,500 |
|
12/31/X1 inventory: |
(1,200) |
|
Cost of sales: |
153,058 |
|
XYZ Inc. |
|
|
Sales |
295,400 |
|
Cost of Goods Sold |
153,058 |
|
Gross profit |
142,342 |
For illustration purposes, only the sales of merchandise 123 are presented.
Lower of cost or market (NRV)
Physical decline in value
In X1, XYZ bought 1,000 units of merchandise #456 for 100 per unit and sold 900 units. 12/31/X1, a physical inventory showed only 90 units were in stock.
For readability this illustration assumes stable prices, so FIFO = weighted average = LIFO.
Under some national GAAPs, the loss may simply recognized without ascertaining its cause. Under IFRS and US GAAP, its cause must always be determined.
In this situation, the loss was due to physical destruction, which was caused by hydraulic line rupture on an otherwise well maintained forklift.
Since XYZ had taken all reasonable steps to avoid such equipment failures, it deemed the destruction be an unforeseeable event. Unfortunately, the forklift manufacture had ceased to do business, so XYZ could not seek compensation.
Note: while admittedly farfetched, if XYZ had received compensation, the example would have also needed to illustrate this, drawing attention away from the main issue.
|
12/31/X1 | 31.12.X1 |
|
|
|
|
Losses: inventory write-off |
1,000 |
|
|
|
|
Inventory: item #456 |
|
1,000 |
A decline in inventory value due to unforeseeable, unpreventable and unavoidable events (e.g. wildfire, flood, earthquake, revolution, war, etc.) is clearly distinguishable from a decline caused by foreseeable, preventable and avoidable issues (e.g. inadequate or improper maintenance, inadequate or improper training or supervision, poor planning, etc.).
This clear difference also necessitates a clearly distinct accounting treatment.
The most common and practical way to achieve this is to recognize and report the former as a "loss" in the non-operating section of the profit and loss statement. The latter would be included in the operating section (in cost of sales, selling expenses, administrative expenses or perhaps general expenses).
Instead of having to rely on common practice and judgment, it would have been preferable if actual guidance could have been cited. Unfortunately neither IFRS nor US GAAP provide concise, succinct guiance applicable to this particular issue.
To further its goal of making its guidance ever more principles based, IFRS also no longer even distinguishes between expenses and losses.
Unlike revenue and gains, which were the components of income, expenses (lower case e) and losses where components of Expenses (upper case E).
Or at least this is how the previous conceptual framework, which included a discussion of the differences, could have been interpreted.
No longer.
As part of its recent update to the conceptual framework, the IASB made the discussion made the discussion more principles-based (a.k.a. more subjective and difficult to apply in practice) by eliminating the distinction between expenses (costs incurred to facilitate the sale of goods or services) and losses (freak events such as floods, fires, or bursting hydraulic lines).
Fortunately, this change is beside the point because the distinction between expenses and losses continues to be drawn at the standard level, for example in IAS 36.126.a to d.
Accounting elements are discussed in more detail on this page.
Consequently, there is no dedicated "non-operating" section in a standard IFRS profit and loss statement (assuming one considers the IASB issued XBRL taxonomy as the most pertinent guidance for structuring an IFRS compatible profit and loss statement) nor a dedicated line item for these losses (the closest is the ImpairmentLoss included in the DisclosureOfImpairmentOfAssetsExplanatory section of the footnotes). This leaves the exact recognition of disclosure to the judgment of the practitioner, as all principals based guidance invariably does.
While the US GAAP conceptual framework does continue to draw a distinction between expenses and losses and FASB XBRL does include a line item that comes close (LossFromCatastrophes), the ASC fails to specify how exactly the loss caused by an unpreventable and unforeseeable decline in the value of inventory should be recognized and reported.
This decline was caused by an unforeseeable event, so was classified as a non-operating loss.
While hydraulic hoses do fail, a widely referenced risk assessment manual (the Bevi Manual) gives a failure frequency for heavily-stressed hydraulic hoses of 4 x 10⁻⁵ per hour (40 failures per million operating hours) and 4 x 10⁻⁶ for lightly-stressed hoses. As these figures are historical, XYZ used the more conservative estimate even though forklift hoses are not as "heavily-stressed" as, for example, mining equipment.
Note: while hose monitoring systems (e.g. the Gates Hose Diagnostic & Monitoring System), are available, XYZ's preventative replacement policy and historical failure rate made the cost of such a system higher than the savings would justify.
Same facts except, the destruction was caused by an accident.
While the forklift operator was trained, experienced and had a solid record, accidents do happen.
This reminds me of the time I was at a client and was given a tour of their warehouse.
Wow! Was I impressed.
The guys on the forklifts zoomed around like a swarm of angry wasps, centimeters apart, at speeds that would make a Formula One driver say: Wow! I'm impressed.
I shared this observation with the Chief accountant to which she replied, yes, they’re a good bunch of guys. Our accident rate is close zero so we let them have their fun. Keeps turnover down. I replied, sure, makes sense, boys will be boys.
|
12/31/X1 | 31.12.X1 |
|
|
|
|
Distribution expenses: inventory write-off |
1,000 |
|
|
|
|
Inventory: item #456 |
|
1,000 |
A decline in value due to a foreseeable event cannot be recognized as a loss (above).
However, if all reasonable steps to avoid the loss were taken, it would fall into the normal waste category (above).
To test this hypothesis, XYZ considered that the operator had received adequate training, was experienced and had a significantly below mean accident rate.
In addition, XYZ also considered that eliminating all operator error could only be accomplished by automation. It thus compared the cost of a traditional, human-operated warehousing system with the cost of installing and maintaining a robotic system. After factoring in the historical damage costs over a period approximating a robotic system's useful life, it concluded the benefit would not justify the cost.
Since the damaged was to merchandise, the balancing entry was distribution expenses.
If the damage had been to WIP, the balancing entry would have been cost of goods sold.
Same facts except the destrution was cuased by an inadequatly trained operator.
|
12/31/X1 | 31.12.X1 |
|
|
|
|
Administrative expenses: inventory write-off |
1,000 |
|
|
|
|
Inventory: item #456 |
|
1,000 |
As discussed above, a reasonably preventable decline in value should be classified as an administrative expense.
The forklift operator was a new hire and did request training on this particular model of forklift with which he had no experience. Instead, the production manager implied that the line of potential forklift operators who did not require any training was long.
The new employee thus did as instructed, and simply got busy.
After the incident report, the replacement production manager ensured all new hires were adequately trained. After being trained, this particular operator not only earned a below mean safety record, but a perfect safety record.
Based on a true story.
Financial decline in value
During X1, XYZ bought 1,000 units of merchandise #456 for 100. 12/31/X1, 100 remained in stock. Prior to year-end, the product's manufacturer cut its price by 50% to clear out its remaining stock. XYZ estimated it would be able to resell its remaining #456 stock for 62.50 per unit (net).
For readability this illustration assumes stable prices, so FIFO = weighted average = LIFO.
While the physical condition of the goods remained the same, the decreased wholesale price led to competition from resellers who purchased the discounted goods and immediately listed them online at an average price (excluding shipping and handling) of 62.50.
To maintain market share, XYZ reducing its asking price to 62.50 (shipping not included).
|
12/31/X1 | 31.12.X1 |
|
|
|
| Losses: inventory write-off
|
3,750 |
|
|
|
|
Inventory: item #456 |
|
3,750 |
This decline in value was certainly unpreventable and unavoidable, but may not have been unforeseeable.
However, to illustrate an unforeseeable decline, this example assumes XYZ had no reason to expect the reduction. Specifically, this was the first time item #456's manufacturer had decided to chage its pricing policy in a way that marmed its existing distributors.
A decline in inventory value due to unforeseeable, unpreventable and unavoidable events (e.g. wildfire, flood, earthquake, revolution, war, etc.) is clearly distinguishable from a decline caused by foreseeable, preventable and avoidable issues (e.g. inadequate or improper maintenance, inadequate or improper training or supervision, poor planning, etc.).
This clear difference also necessitates a clearly distinct accounting treatment.
The most common and practical way to achieve this is to recognize and report the former as a "loss" in the non-operating section of the profit and loss statement and include the latter in the appropriate section of the operating section (cost of sales, selling expenses, administrative expenses or perhaps general expenses).
Instead of having to rely on common practice and judgment, it would have been preferable if actual guidance could have been cited. Unfortunately neither IFRS nor US GAAP provide concise succinct guiance applicable to this particular issue.
To further its goal of making its guidance ever more principles based, IFRS also no longer distinguishes between expenses and losses.
Unlike revenue and gains, which were the components of income, expenses (lower case e) and losses where components of Expenses (upper case E).
Or at least this is how the previous conceptual framework, which included a discussion of the differences, could have been interpreted.
No longer.
As part of its recent update to the conceptual framework, the IASB made the discussion made the discussion more principles-based (a.k.a. more subjective and difficult to apply in practice) by eliminating the distinction between expenses (costs incurred to facilitate the sale of goods or services) and losses (freak events such as floods, fires, or bursting hydraulic lines).
Fortunately, this change is beside the point because the distinction between expenses and losses continues to be drawn at the standard level, for example in IAS 36.126.a to d.
Accounting elements are discussed in more detail on this page.
Consequently, there is no dedicated "non-operating" section in a standard IFRS profit and loss statement (assuming one considers the IASB issued XBRL taxonomy as the most pertinent guidance for structuring an IFRS compatible profit and loss statement) nor a dedicated line item for these losses (the closest is the ImpairmentLoss included in the DisclosureOfImpairmentOfAssetsExplanatory section of the footnotes). This leaves the exact recognition of disclosure to the judgment of the practitioner, as all principals based guidance invariably does.
While the US GAAP conceptual framework does continue to draw a distinction between expenses and losses and FASB XBRL does include a line item that comes close (LossFromCatastrophes), the ASC fails to specify how exactly the loss caused by an unpreventable and unforeseeable decline in the value of inventory should be recognized and reported.
Obviously, one the decline was properly recognized XYZ's purchasing manager began searching for comparable products so XYZ could discontinue carrying products manufactured by an unreliable business partner.
Same facts except, XYZ had experienced managers capable of making reasonable decisions.
Occasionally, to make room for new products, manufacturers need to clear out physical inventory space so offer their remain stock to discounters who immediately put it online at radically low prices. Once this stock is sold, those retailers who are savvy enough to distinguish a permanent delinked from a temporary pullback can sell the stock they decided to hold on to and not sell at such artificially deflated levels.
|
12/31/X1 | 31.12.X1 |
|
|
|
|
Losses: Inventory write-down |
3,750 |
|
|
|
|
Inventory: allowance: item #456 | Inventory: item #456 |
|
3,750 |
XYZ's manager considered the situation and concluded XYZ would not reduce its selling price. The reason is that the below-market goods would be cleared from the market very quickly. As these goods would not fully satiate market demand, once this underpriced stock was gone, prices would begin to recover. However, if XYZ reduced its prices, not only would it crystallize the loss, but if it did not clear out its #456, it could not subsequently raise its prices without alienating its customer base.
Consequently, while the net realizable value of #456 did decline as of 12/31/X1 and a loss had to be recognized, XYZ's accounting department recognized it as an allowance so it could be, with minimum effort, subsequently reversed.
This is an IFRS only option.
As outlined in IAS 2.33 if inventory is written down to NRV and subsequently sold at a higher price, the writedown is reversed. This requiments eliminates the possiblity of both creating hedeen reseves in inventory and understating future cost og doods sold.
From a practical, acocunting perspective, it also implies that, if an entity asusmes NRV could increase in future period, rather than writing off the inventory item directly, it would recognize an allowance (contra asset) which would make the potential future revesal more clearly visable, tracable and auditable.
XYZ's manager considered the situation and concluded XYZ would not reduce its selling price. The reason is that the below-market goods would be cleared from the market very quickly. As these goods would not fully satiate market demand, once this underpriced stock was gone, prices would begin to recover. However, if XYZ reduced its prices, not only would it crystallize the loss, but if it did not clear out its #456, it could not subsequently raise its prices without alienating its customer base.
Consequently, while the net realizable value of #456 did decline as of 12/31/X1 and a loss had to be recognized, XYZ's accounting department decided to not recognize an allowance as losses may not be reversed under US GAAP.
As specified by ASC 330-10-35-14, a write-down to NRV at the end of the fiscal period establishes a new cost basis. Consequently, it is irreversible. Thus, while not disallowed, recording an allowance would be pointless.
As outlined in IAS 2.33 if inventory is written down to NRV and subsequently sold at a higher price, the writedown is reversed. This requiments eliminates the possiblity of both creating hedeen reseves in inventory and understating future cost og doods sold.
From a practical, acocunting perspective, it also implies that, if an entity asusmes NRV could increase in future period, rather than writing off the inventory item directly, it would recognize an allowance (contra asset) which would make the potential future revesal more clearly visable, tracable and auditable.
Same facts, except XYZ actually sold the goods for 110 per unit on 1/15/X2.
IFRS | US GAAP
|
1/15/X2 | 15.1.X2 |
|
|
|
|
Cash |
11,000 |
|
|
|
|
Revenue |
|
11,000 |
|
Inventory: allowance: item #456 |
3,750 |
|
|
|
|
Losses: Inventory write-down |
|
3,750 |
|
Cost of goods sold |
10,000 |
|
|
|
|
Inventory: item #456 |
|
10,000 |
|
1/15/X2 | 15.1.X2 |
|
|
|
|
Cash |
11,000 |
|
|
|
|
Revenue |
|
11,000 |
|
Cost of goods sold |
6,250 |
|
|
|
|
Inventory: item #456 |
|
6,250 |
As specified by ASC 330-10-35-14, a write-down to NRV at the end of the fiscal period establishes a new cost basis. Consequently, it is irreversible.
This prohibition on reversal opens the door to hidden reserves in inventory and understated cost of sales.
Consequently, an entity should anticipate a considerably higher level of auditor scrutiny not only as to the justification but especially measurement of inventory write-downs. This also implies, that an entity that begins displaying a history of selling previously written-down inventory at amounts higher than NRV should be prepared to adequately justify policy to its auditor. Failing that, the entity should be prepared to apply ASC 250-10-45-23.
So, a word to the wicked: one of the fastest ways to a qualified opinion and/or restatement, abusing US GAAP's no-reversal guidance to play games with cost of sales.
Also retail method and LIFO.
ASC 330-10-35-1C continues to require lower of cost or market (the old ceiling / floor approach) for retail method or LIFO inventory.
However, this marginal issue is not sufficiently important to warrant a separate illustration particularly as this site recommend not using the retail method or LIFO.
Intentional decline in value
XYZ is a producer of carbonated beverages. Due to relatively low manufacturing and high out-of-stock costs, it commonly overproduces. To properly match revenue and expenses, it ages its inventory.
Delivering just-in-time requires firm schedules from customers. Occasionally, however, some customers require delivery just in time but do not provide these schedules. In this situation, to meet customer demands, a company may overproduce. In this illustration, XYZ's customers required delivery with 30 minutes’ notice, which caused XYZ to produce beverages in the hope that the inventory would be sold. As this production was intentional, it should be recognized as an expense in the period the decision was made, not in the period the obsolete inventory was physically liquidated.
Automotive is another industry where intentional overproduction is prevalent. For example, if a manufacturer sets up production tools to make parts for the currently produced model, it may also produce additional parts so it will be able to meet warranty claims, as this is more cost-effective than having to again, subsequently retool just to produce spare parts. However, not all the spare parts are sold. Eventually, they are liquidated to free up warehousing space, often at a price less than the cost to produce.
Again, as the decision to overproduce parts in, for example, period X1 was associated with models produced in X1, it should be included in X1's expenses, not the expenses in, for example, X5, when the obsolete inventory is liquidated.
Doing otherwise would fail to fulfill the guidance of matching costs to revenue, most notably IFRS 15.95 and ASC 340-40-25-5.
|
Age in months |
6 |
5 |
4 |
3 |
2 |
1 |
Total |
|
Batch # |
7.14 |
8.812 |
9.67 |
10.6712 |
11.1511 |
12.314 |
|
|
Total cost of batch |
400 |
800 |
700 |
1200 |
2400 |
4100 |
|
|
Factor |
100% |
83% |
67% |
50% |
33% |
17% |
|
|
Allowance |
400 |
664 |
469 |
600 |
792 |
697 |
3,622 |
|
12/31/X1 | 31.12.X1 |
|
|
|
|
Obsolete inventory expense |
3,622 |
|
|
|
|
Allowance for obsolete inventory |
|
3,622 |
1/15/X2, it physically liquidated batch #07.14 that had cost 0.40 per unit to produce.
|
1/15/X2 | 15.1.X2 |
|
|
|
|
Allowance for obsolete inventory |
400 |
|
|
|
|
Inventory: batch #01-04 |
|
400 |